
2/53 Gateway BoulevardEpping VIC 3076
Property Details for 2/53 Gateway Bvd, Epping
Last Listing description (July 2019)
Tenanted Investment.
Exciting opportunity for an investor to purchase an office warehouse facility, located in a boutique development within a proven industrial precinct. Superbly positioned with easy access to the Melbourne Wholesale Fruit , Vegetable Market, Ring Road and Hume Highway.
Office Area: 60m2
Warehouse Area: 342m2
Property History for 2/53 Gateway Bvd, Epping, VIC 3076
- 25 Oct 2018Listed for Sale $720,000 Plus GST (if any)
- 18 Dec 2008Listed for Rent - Price not available
Recent sales nearby
See more recent sales nearbySimilar properties For Sale nearby
See more properties for sale nearby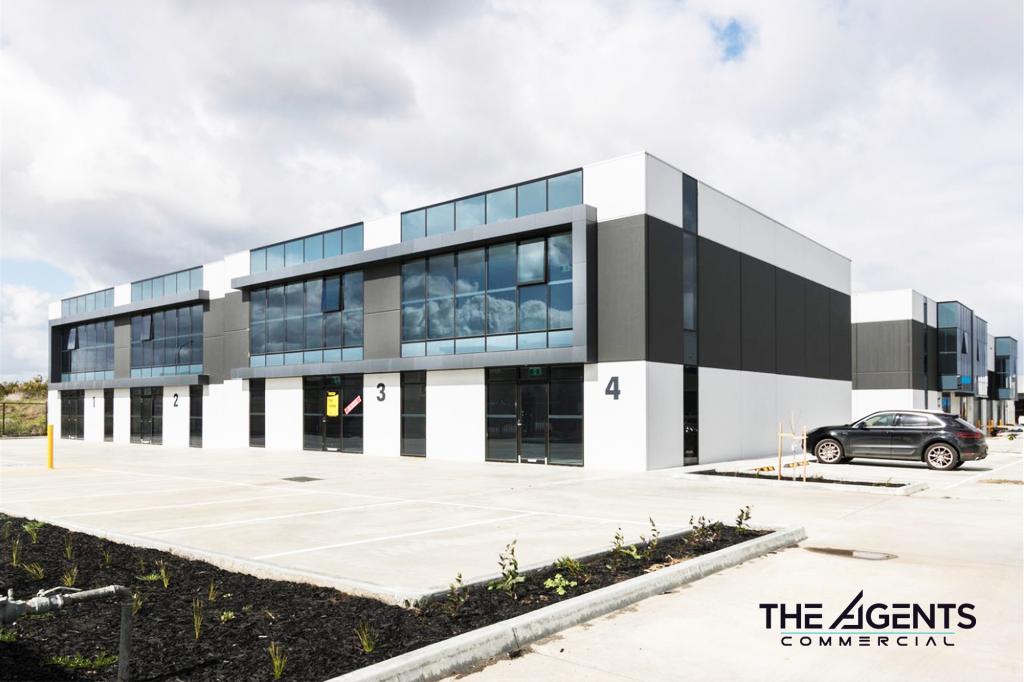 0
0
 0
0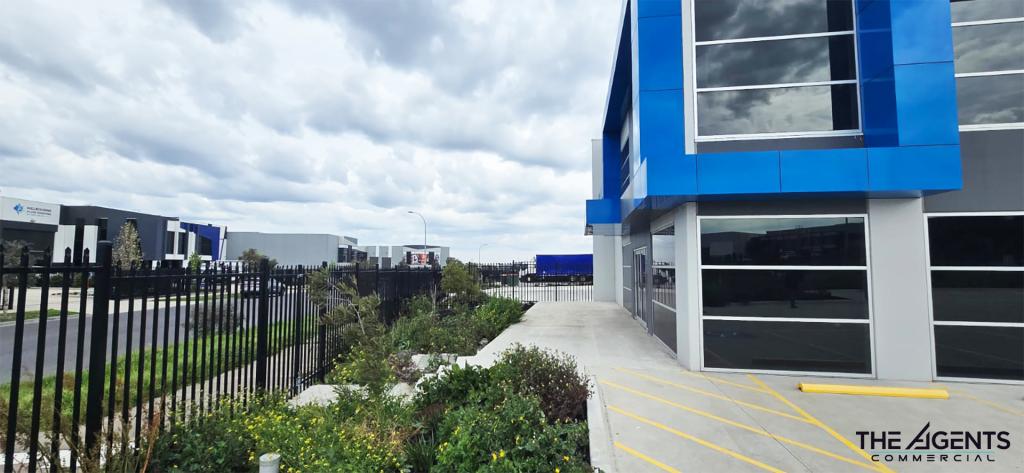 0
0Similar properties For Rent nearby
See more properties for rent nearby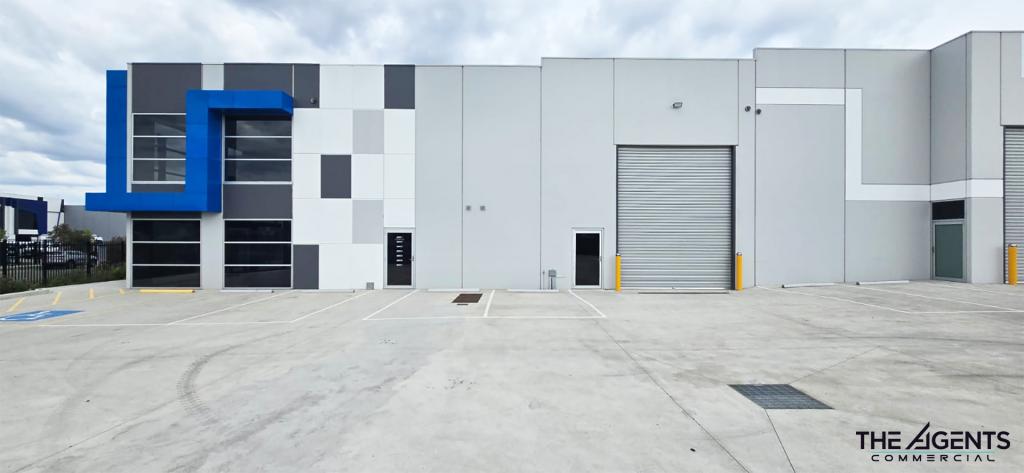 0
0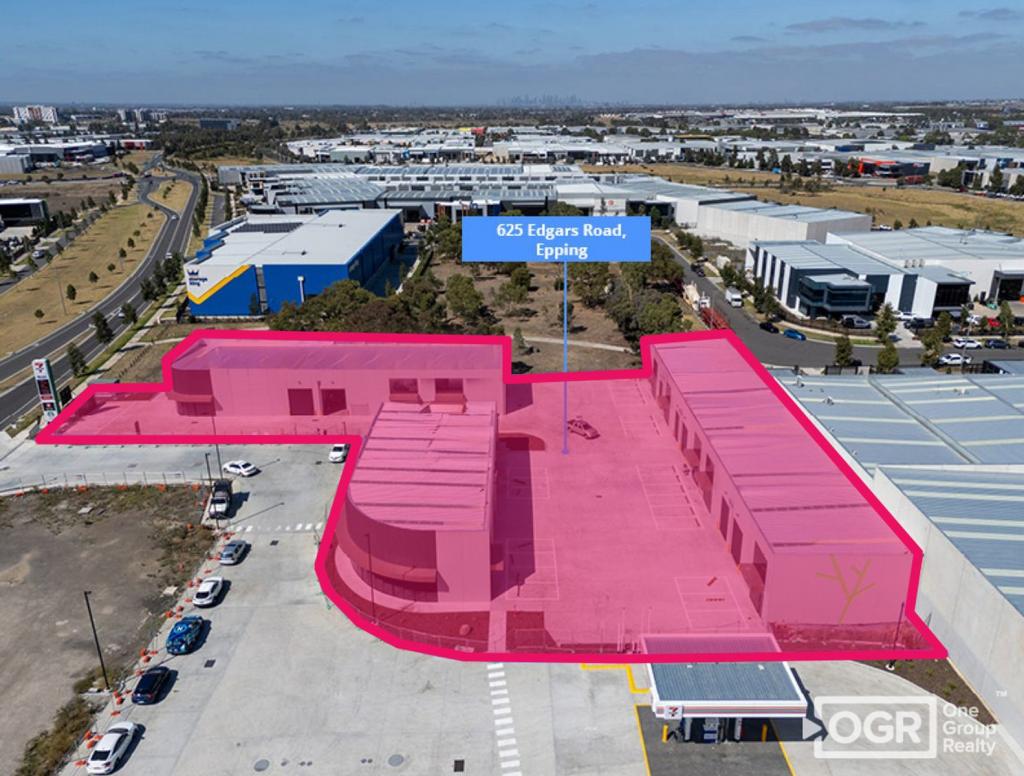 0
0About Epping 3076
The size of Epping is approximately 33.7 square kilometres. It has 107 parks covering nearly 17.6% of total area. The population of Epping in 2016 was 32395 people. By 2021 the population was 33489 showing a population growth of 3.4% in the area during that time. The predominant age group in Epping is 30-39 years. Households in Epping are primarily couples with children and are likely to be repaying $1800 - $2399 per month on mortgage repayments. In general, people in Epping work in a professional occupation.In 2021, 67.70% of the homes in Epping were owner-occupied compared with 68.70% in 2016.
Epping has 17,337 properties. Over the last 5 years, Houses in Epping have seen a 25.80% increase in median value, while Units have seen a 25.38% increase. As at 28 February 2026:
- The median value for Houses in Epping is $785,504 while the median value for Units is $542,716.
- Houses have a median rent of $550 while Units have a median rent of $485.
Suburb Insights for Epping 3076
Market Insights
Epping Trends for Houses
N/A
N/A
View TrendN/A
N/A
Epping Trends for Units
N/A
N/A
View TrendN/A
N/A
Neighbourhood Insights
© Copyright 2026. RP Data Pty Ltd trading as Cotality (Cotality). All rights reserved. No reproduction, distribution, or transmission of the copyrighted materials is permitted. The information is deemed reliable but not guaranteed.
While Cotality uses commercially reasonable efforts to ensure the Cotality Data is current, Cotality does not warrant the accuracy, currency or completeness of the Cotality Data and to the full extent permitted by law excludes all loss or damage howsoever arising (including through negligence) in connection with the Cotality Data.
This product uses cookies and other similar technologies to improve and customise your browsing experience, to tailor content and adverts, and for analytics and metrics regarding visitor usage on this product and other media. We may share cookie and analytics information with third parties for the purposes of advertising. By continuing to use our website, you consent to cookies being used. View our Privacy Policy here.
X