
3 Hingston CloseBonython ACT 2905
Property Details for 3 Hingston Cl, Bonython
3 Hingston Cl, Bonython is a 3 bedroom, 2 bathroom House and was built in 1980. The property has a land size of 742m2 and floor size of 129m2. While the property is not currently for sale or for rent, it was last sold in September 1999.
Property History for 3 Hingston Cl, Bonython, ACT 2905
- 07 Sep 1999Sold for $145,000

Recent sales nearby
See more recent sales nearby
Similar properties For Sale nearby
See more properties for sale nearby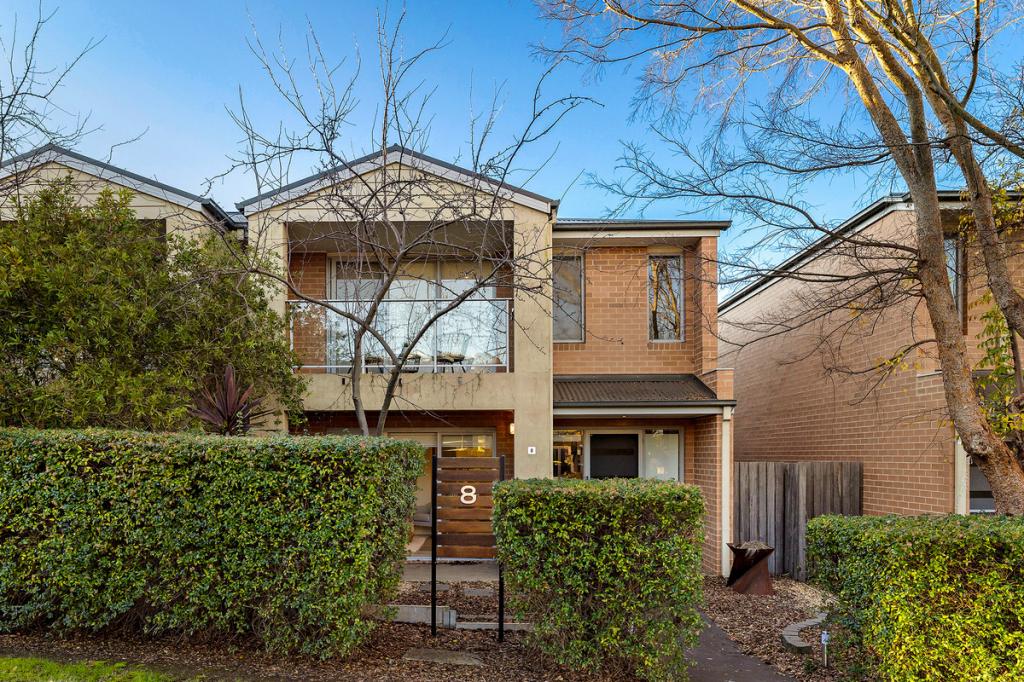 0
0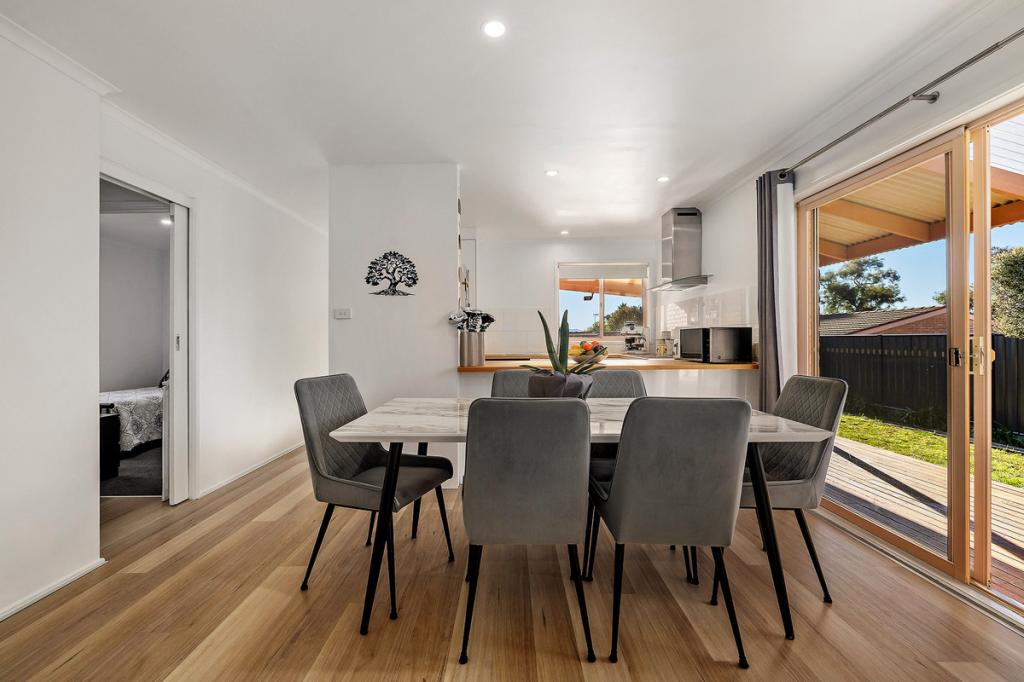 0
0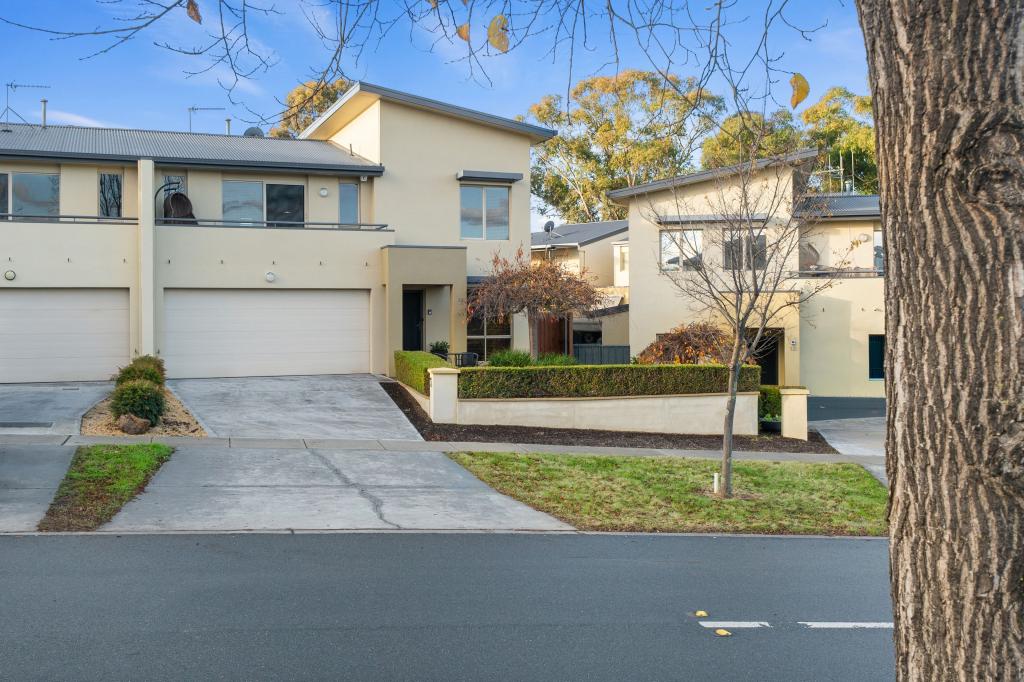 0
0Similar properties For Rent nearby
See more properties for rent nearby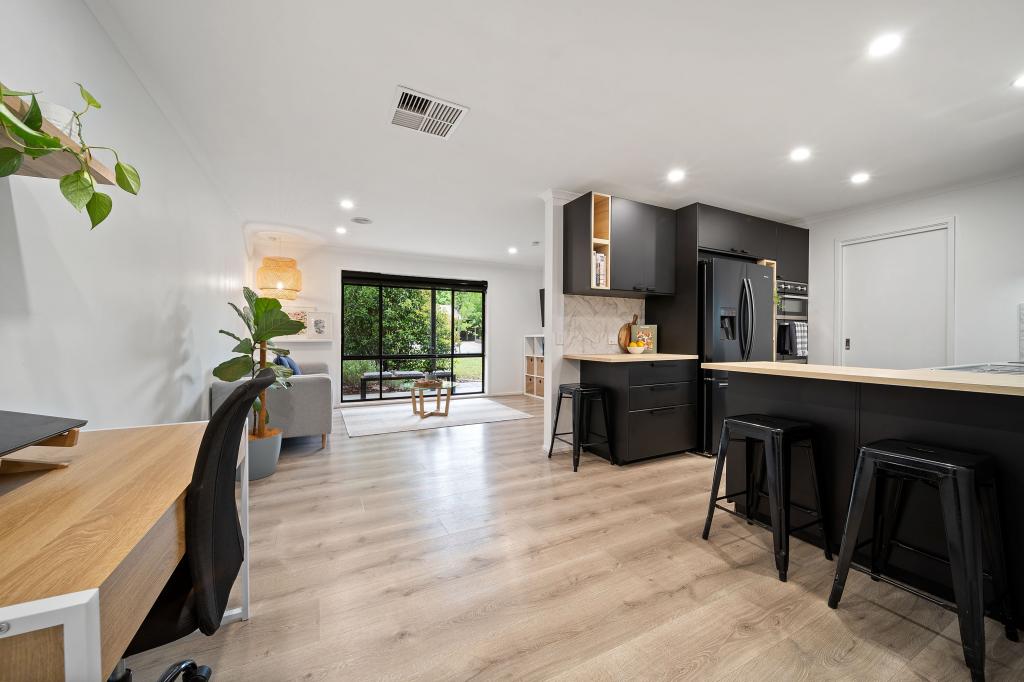 0
0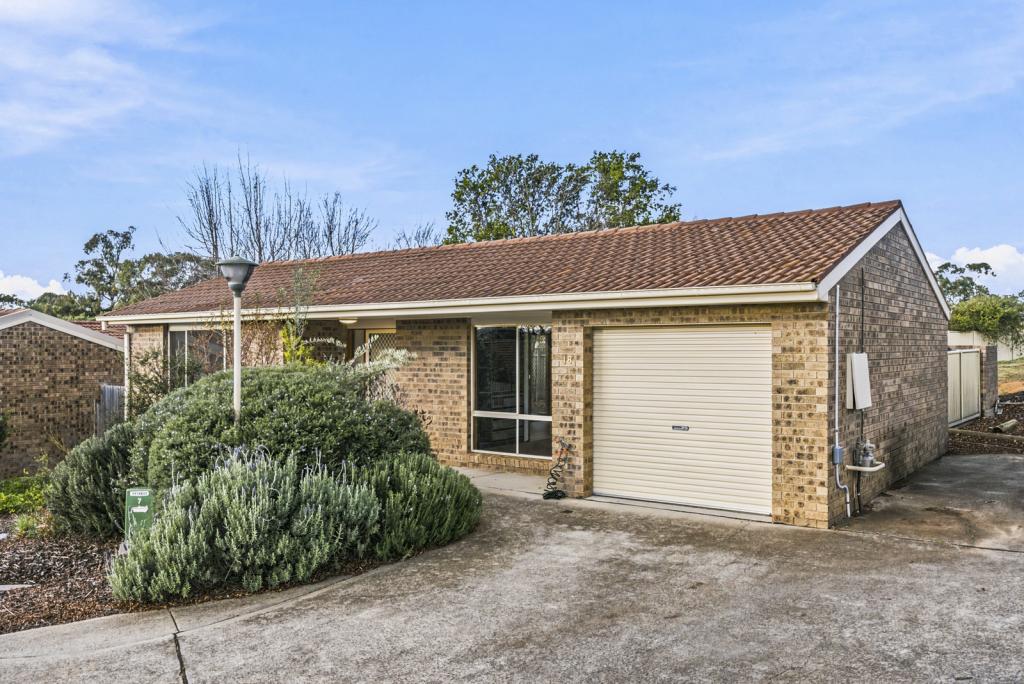 0
0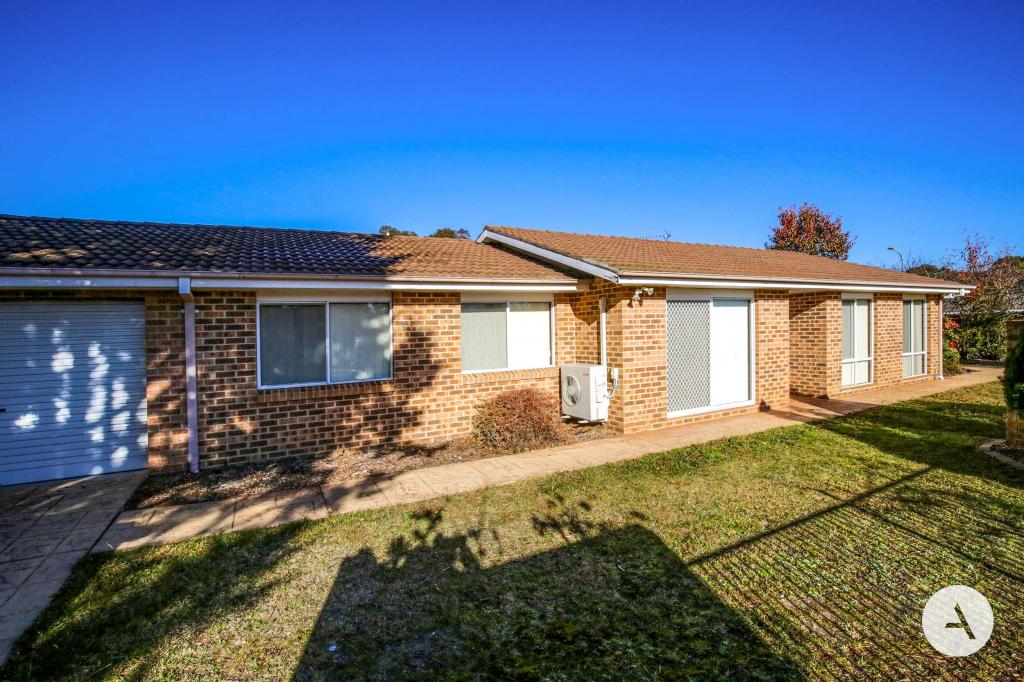 0
0About Bonython 2905
The size of Bonython is approximately 2.9 square kilometres. There are 10 parks, covering nearly 48.7% of the total area. The population of Bonython in 2016 was 3786 people. By 2021 the population was 3839 showing a population growth of 1.4% in the area during that time. The predominant age group in Bonython is 50-59 years. Households in Bonython are primarily couples with children and are likely to be repaying $1800 - $2399 per month on mortgage repayments. In general, people in Bonython work in a professional occupation.In 2021, 70.50% of the homes in Bonython were owner-occupied compared with 65.80% in 2016.
Bonython has 1,588 properties. Over the last 5 years, Houses in Bonython have seen a 22.73% increase in median value, while Units have seen a 26.31% increase. As at 30 June 2026:
- The median value for Houses in Bonython is $1,025,201 while the median value for Units is $757,206.
- Houses have a median rent of $700 while Units have a median rent of $635.
Suburb Insights for Bonython 2905
Market Insights
Bonython Trends for Houses
N/A
N/A
View TrendN/A
N/A
Bonython Trends for Units
N/A
N/A
View TrendN/A
N/A
Neighbourhood Insights
© Copyright 2026. RP Data Pty Ltd trading as Cotality (Cotality). All rights reserved. No reproduction, distribution, or transmission of the copyrighted materials is permitted. The information is deemed reliable but not guaranteed.
While Cotality uses commercially reasonable efforts to ensure the Cotality Data is current, Cotality does not warrant the accuracy, currency or completeness of the Cotality Data and to the full extent permitted by law excludes all loss or damage howsoever arising (including through negligence) in connection with the Cotality Data.
This product uses cookies and other similar technologies to improve and customise your browsing experience, to tailor content and adverts, and for analytics and metrics regarding visitor usage on this product and other media. We may share cookie and analytics information with third parties for the purposes of advertising. By continuing to use our website, you consent to cookies being used. View our Privacy Policy here.
X