72 Langhorne StreetDandenong VIC 3175

Thinking about insurance?
Get estimated rebuild costs for this property with Sum SureProperty Details for 72 Langhorne St, Dandenong
72 Langhorne St, Dandenong is a 5 bedroom, 2 bathroom House and was built in 1980. The property has a land size of 1465m2 and floor size of 341m2. While the property is not currently for sale or for rent, it was last transferred in February 2015.
Last Listing description (April 2024)
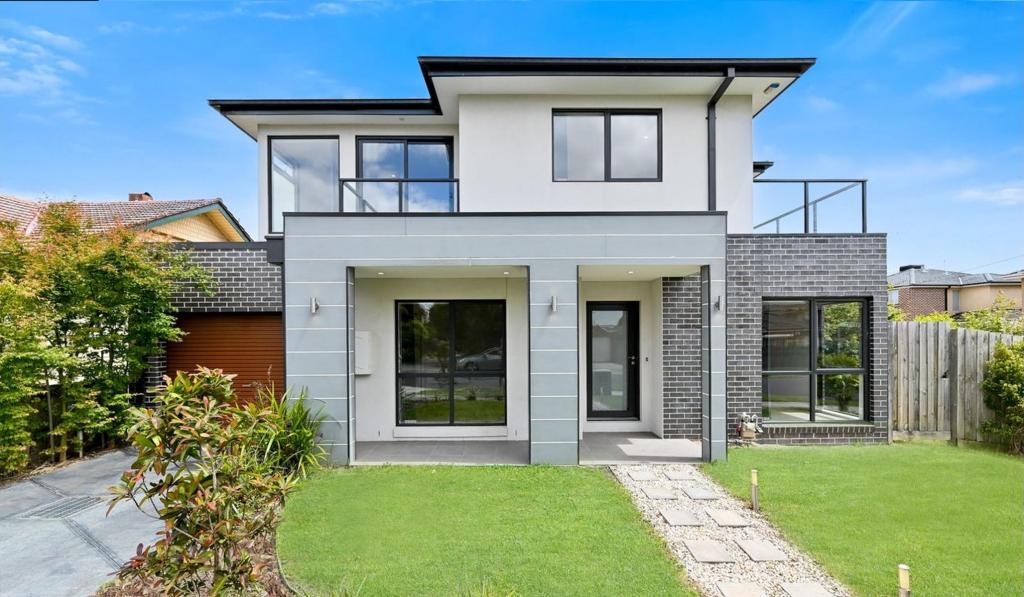
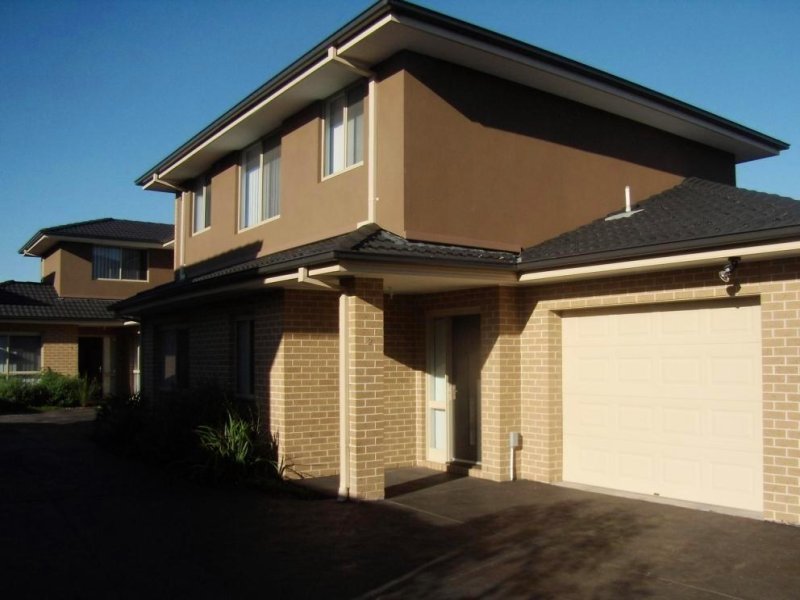
Situated only approx. 300 meters from the centre of town and close to Parkland, Schools and Railway Station, this magnificent site of 1,475m2 has a 29 metre frontage, ideal for a quality development. Zone is GRZ.
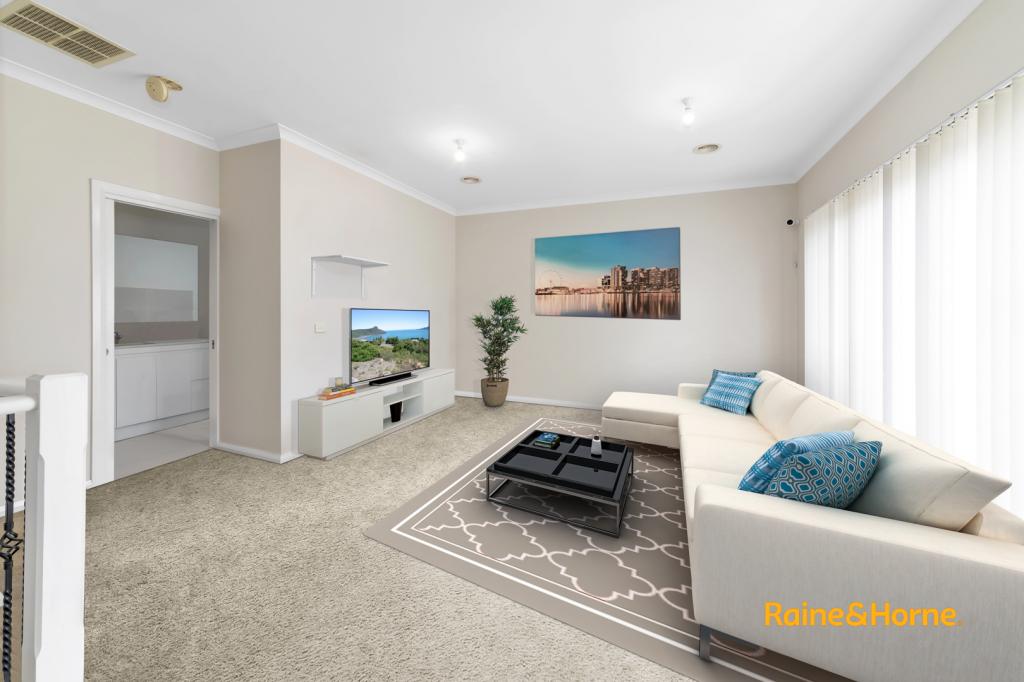
A substantial five bedroom, two bathroom home with three separate living areas including an enormous rumpus room, provides you with a rental return until your plans are approved. Builders can expect high demand for your end product as this location is second to none!
The big blocks are going fast!
We have obtained all information in this document from sources we believe to be reliable; however, we cannot guarantee its accuracy. We do not accept any responsibility to any person for its accuracy and do no more than pass it on. All interested parties are advised to carry out their own investigations, and should make and rely upon their own enquiries in order to determine whether or not this information is in fact accurate.
Property History for 72 Langhorne St, Dandenong, VIC 3175
- 17 Jul 2023Listed for Sale $1,500,000-$1,650,000
- 01 Apr 2021Listed for Sale $1,400,000-$1,540,000
- 12 May 2017Listed for Sale Not Disclosed
Local Area Liveability Score
This Liveability Score is a rating "out of 10" and a guide to how well connected properties within a local area are to facilities such as public transport, healthcare services, shopping outlets, schools and parkland. The scores apply to the local area (or "mesh block") in which a property is located. The scores are largely comprised of 2 main elements:
- Walking time to a local facility
- Number of facilities within a 20-minute walk
The overall Liveability Score is made up of smaller sub-scores, as described below.
Recent sales nearby
See more recent sales nearbySimilar properties For Sale nearby
See more properties for sale nearby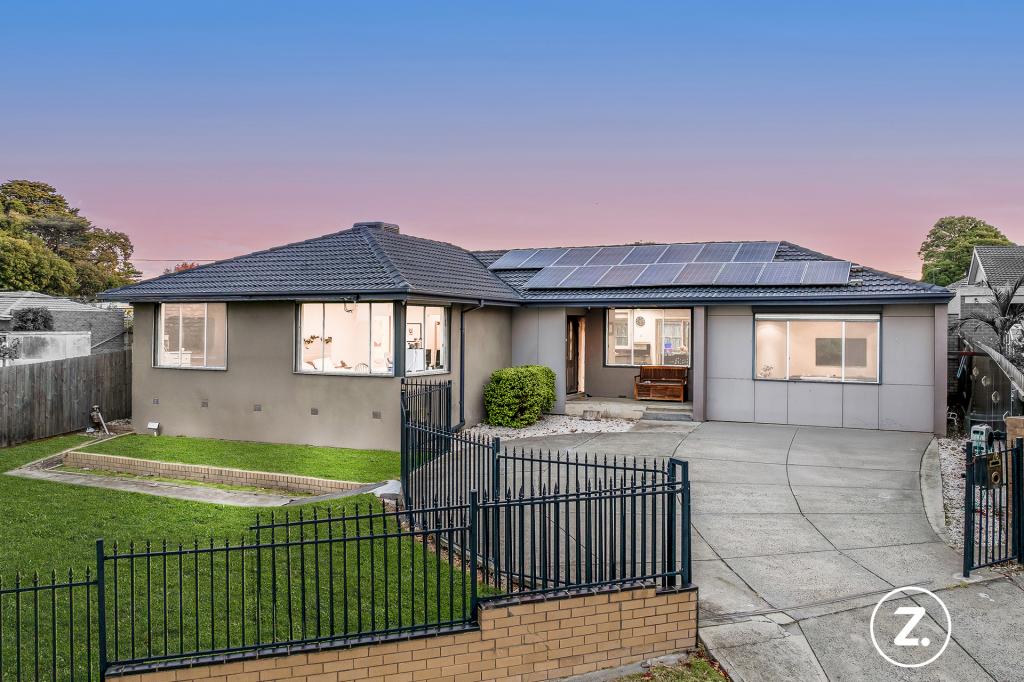


Similar properties For Rent nearby
See more properties for rent nearby
About Dandenong 3175
The size of Dandenong is approximately 11.3 square kilometres. It has 22 parks covering nearly 16.6% of total area. The population of Dandenong in 2011 was 24,919 people. By 2016 the population was 29,910 showing a population growth of 20.0% in the area during that time. The predominant age group in Dandenong is 20-29 years. Households in Dandenong are primarily couples with children and are likely to be repaying $1400 - $1799 per month on mortgage repayments. In general, people in Dandenong work in a trades occupation. In 2011, 42.8% of the homes in Dandenong were owner-occupied compared with 39.7% in 2016.
Dandenong has 18,167 properties. Over the last 5 years, Houses in Dandenong have seen a 17.33% increase in median value, while Units have seen a 17.37% increase. As at 30 April 2025:
- The median value for Houses in Dandenong is $766,051 while the median value for Units is $438,106.
- Houses have a median rent of $530 while Units have a median rent of $450.
What's around 72 Langhorne St, Dandenong
72 Langhorne St, Dandenong is in the school catchment zone for Dandenong Primary School and Dandenong High School.


Suburb Insights for Dandenong 3175
Market Insights
Dandenong Trends for Houses
$766k
1.14%
View Trend$530/W
3.82%
Dandenong Trends for Units
$438k
-1.21%
View Trend$450/W
5.56%
Neighbourhood Insights
Age
Population 29,910
0-9
14%
10-19
10%
20-29
19%
30-39
19%
40-49
12%
50-59
10%
60-69
7%
70-79
5%
80-89
3%
90-99
1%
Household Structure
Occupancy
© Copyright 2025 RP Data Pty Ltd trading as CoreLogic Asia Pacific (CoreLogic). All rights reserved.
This product uses cookies and other similar technologies to improve and customise your browsing experience, to tailor content and adverts, and for analytics and metrics regarding visitor usage on this product and other media. We may share cookie and analytics information with third parties for the purposes of advertising. By continuing to use our website, you consent to cookies being used. View our Privacy Policy here.
X