
32 Lyndley StreetBusby NSW 2168
Property Details for 32 Lyndley St, Busby
32 Lyndley St, Busby is a 6 bedroom, 3 bathroom House with 2 parking spaces and was built in 1960. The property has a land size of 613m2 and floor size of 144m2. While the property is not currently for sale or for rent, it was last sold in October 2021.
Last Listing description (August 2007)
You'll Be Charmed!
You will be charmed with this cosy home offering 4 bedrooms, air conditioning, built in robes, floorboards, large living area, renovated kitchen and bathroom. All this is located on a large land with landscaping and close to Green Valley shopping cetre, schools and t-way. Do not miss out on this beautiful home. Call 9822 8224 now to organise an inspection.
Property History for 32 Lyndley St, Busby, NSW 2168
- 12 Oct 2021Sold for $750,000
- 14 Oct 2007Listed for Sale Not Disclosed
- 14 Aug 2007Sold for $283,000

Recent sales nearby
See more recent sales nearbySimilar properties For Sale nearby
See more properties for sale nearby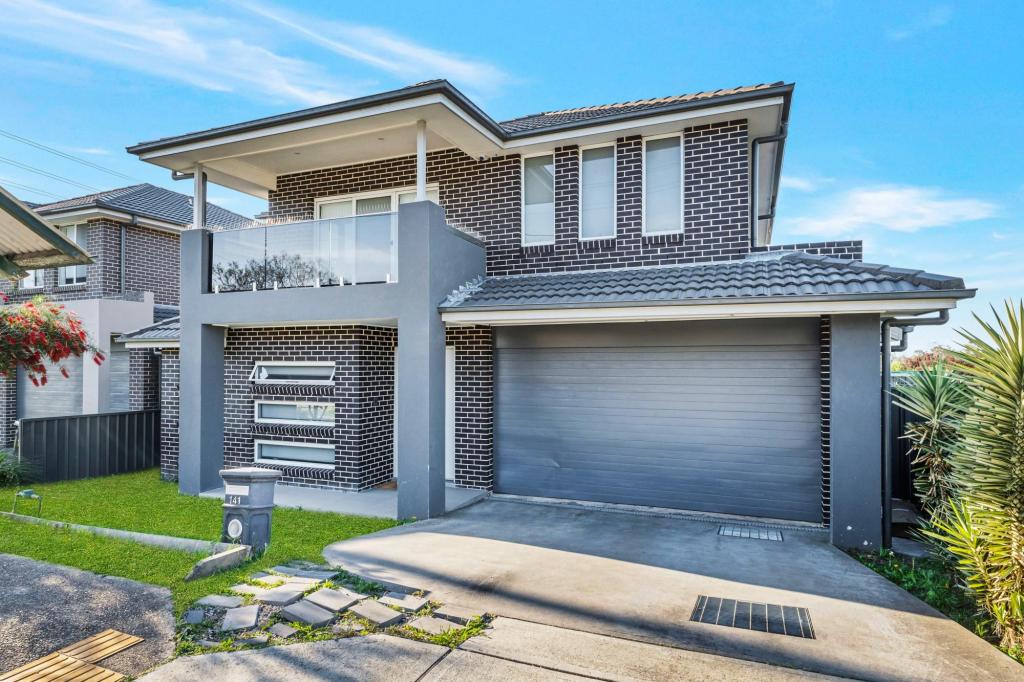 0
0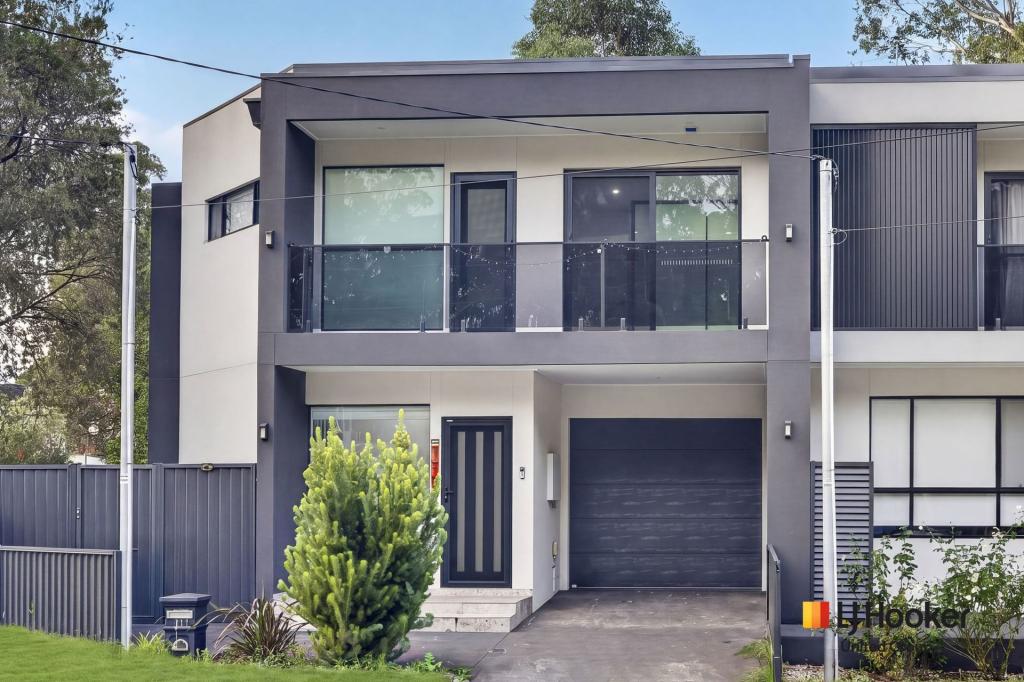 0
0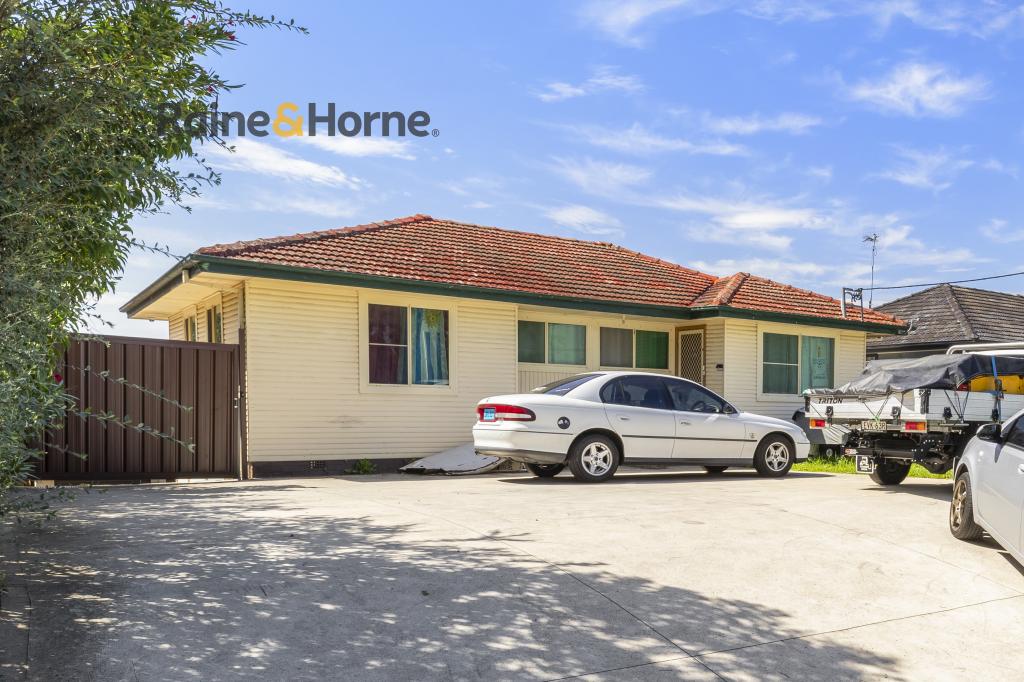 0
0
Similar properties For Rent nearby
See more properties for rent nearby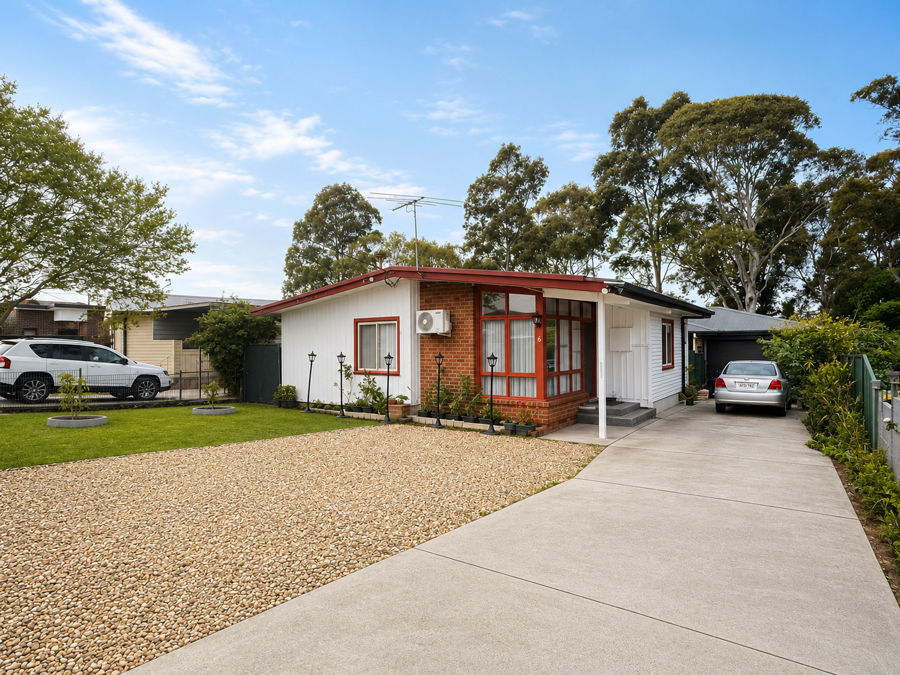 0
0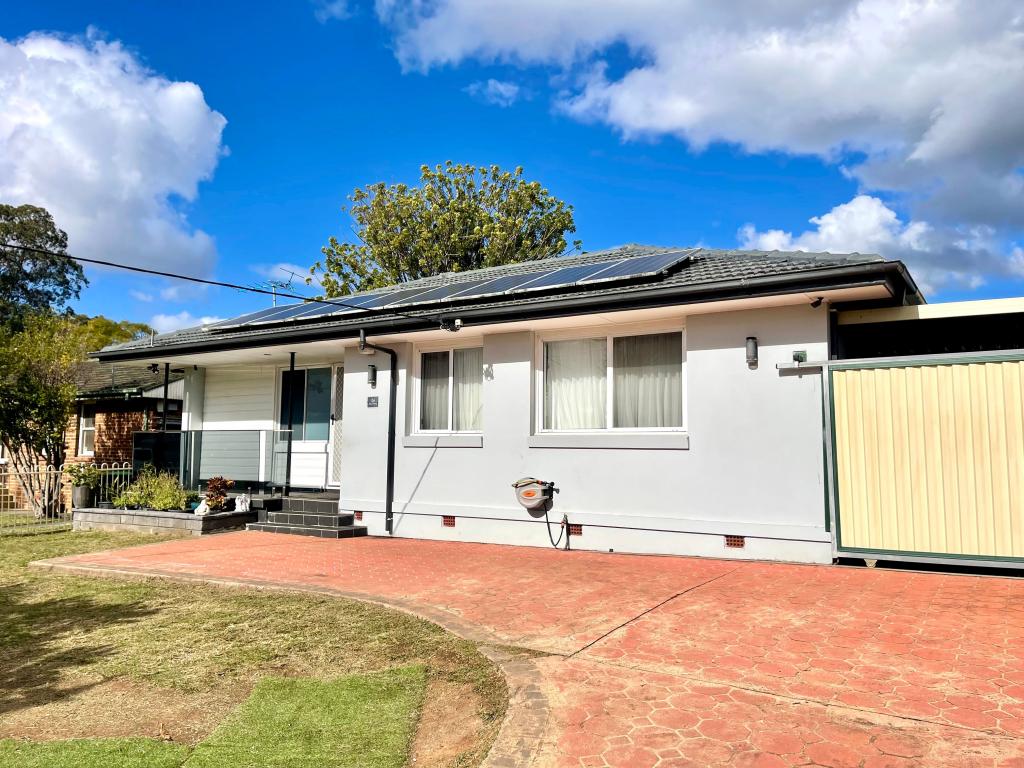 0
0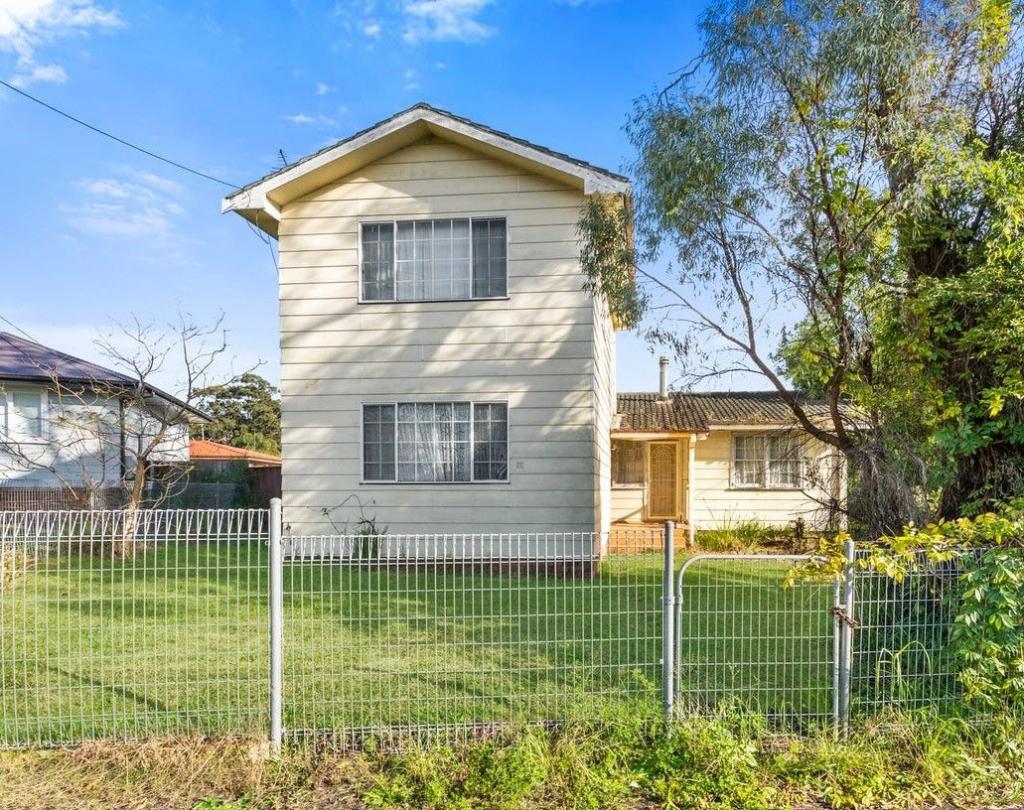 0
0
About Busby 2168
The size of Busby is approximately 1.2 square kilometres. There are 9 parks, covering nearly 12.0% of the total area. The population of Busby in 2016 was 4290 people. By 2021 the population was 4446 showing a population growth of 3.6% in the area during that time. The predominant age group in Busby is 10-19 years. Households in Busby are primarily couples with children and are likely to be repaying $1800 - $2399 per month on mortgage repayments. In general, people in Busby work in a machinery operators and drivers occupation.In 2021, 44.70% of the homes in Busby were owner-occupied compared with 47.70% in 2016.
Busby has 1,477 properties. Over the last 5 years, Houses in Busby have seen a 48.12% increase in median value, while Units have seen a 52.48% increase. As at 30 June 2026:
- The median value for Houses in Busby is $982,751 while the median value for Units is $743,051.
- Houses have a median rent of $580 while Units have a median rent of $490.
Suburb Insights for Busby 2168
Market Insights
Busby Trends for Houses
N/A
N/A
View TrendN/A
N/A
Busby Trends for Units
N/A
N/A
View TrendN/A
N/A
Neighbourhood Insights
© Copyright 2026. RP Data Pty Ltd trading as Cotality (Cotality). All rights reserved. No reproduction, distribution, or transmission of the copyrighted materials is permitted. The information is deemed reliable but not guaranteed.
While Cotality uses commercially reasonable efforts to ensure the Cotality Data is current, Cotality does not warrant the accuracy, currency or completeness of the Cotality Data and to the full extent permitted by law excludes all loss or damage howsoever arising (including through negligence) in connection with the Cotality Data.
This product uses cookies and other similar technologies to improve and customise your browsing experience, to tailor content and adverts, and for analytics and metrics regarding visitor usage on this product and other media. We may share cookie and analytics information with third parties for the purposes of advertising. By continuing to use our website, you consent to cookies being used. View our Privacy Policy here.
X