111 Mangles StreetSouth Bunbury WA 6230
Property Details for 111 Mangles St, South Bunbury
111 Mangles St, South Bunbury is a 2 bedroom, 1 bathroom House and was built in 1946. The property has a land size of 656m2 and floor size of 80m2. While the property is not currently for sale or for rent, it was last sold in September 2015.
Last Listing description (October 2024)
Character home available in sought after South Bunbury location. Within close proximity to shops, schools, sporting facilities, beach and all that Bunbury has to offer. Features include:- Two good sized bedrooms & one bathroom- Separate lounge room- Large country style kitchen with ample cupboard space- Sleep out that could easily double as a home office- Garden shed to large rear enclosed yard- Corner blockAvailable from 30/9/24, $470 per week. To register your interest for a viewing of this property, please visit realestate.com.au and complete your details under the Inspections tab. It is important to register your details to ensure you are notified of any viewings or scheduled viewing time changes/cancellations. Please note that you must view this property prior to applying for tenancy. It is strongly recommended that you do a drive by of the property to familiarise yourself with its location prior to inspecting. ** Potential Tenants should complete their own due diligence, including a visual inspection before entering an offer to lease and should not rely on the photos or text in this advertising.
Property History for 111 Mangles St, South Bunbury, WA 6230
- 16 Sep 2024Listed for Rent - Price not available
- 30 Mar 2023Listed for Rent $360 / week
- 03 Dec 2020Listed for Rent $280 / week

Recent sales nearby
See more recent sales nearby/assets/perm/yp3xjiki7yi6zpcyexujue47my?signature=420f9e7caa822bc1ac3c2453c6cff99659a586e3a207b0c1ffa4bbdd0b5b118e) 0
0
/assets/perm/r4kcfrqglui63dc5h4ntrjrin4?signature=715b03c6a43b3da5133821f96a2185951e437ac75302ef57b050f4865bc92ff9) 0
0
/assets/perm/fgb4ir56nyi6naabgodl67qkt4?signature=4b04d164aee87d6edbf2d94008b9bcdd8a96f6bfcdd5db5ac3cf9a2343ed4982) 0
0Similar properties For Sale nearby
See more properties for sale nearby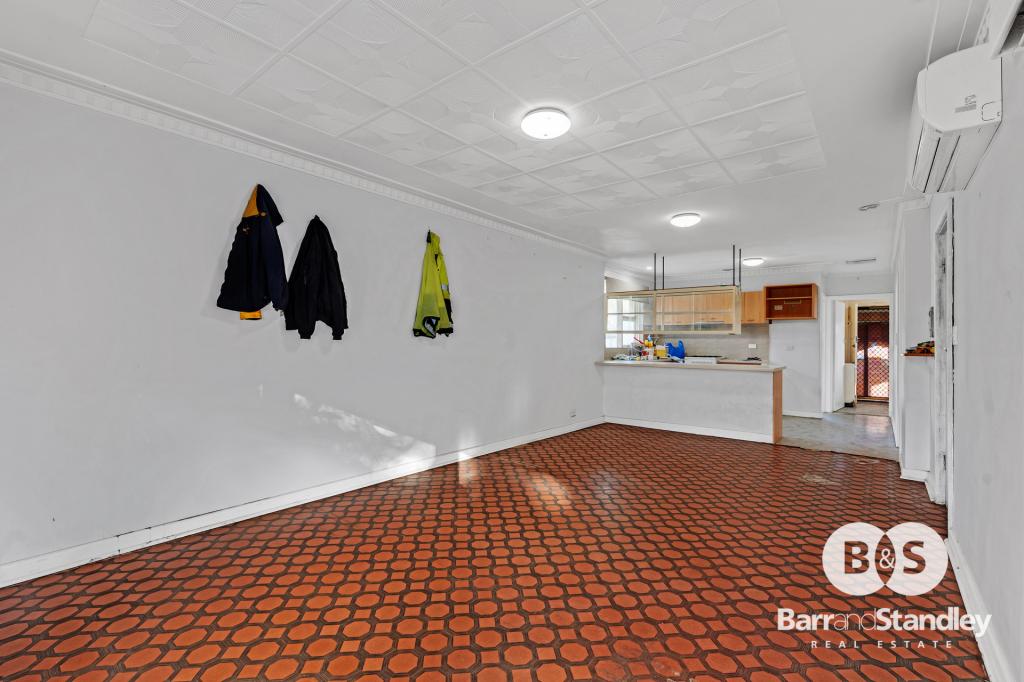 0
0
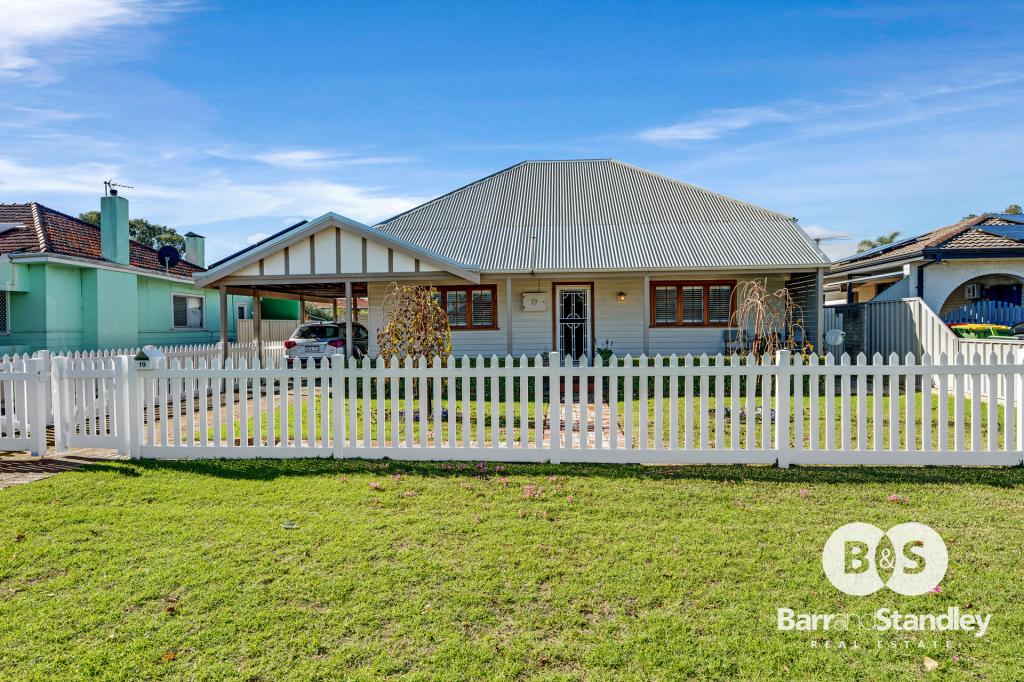 0
0
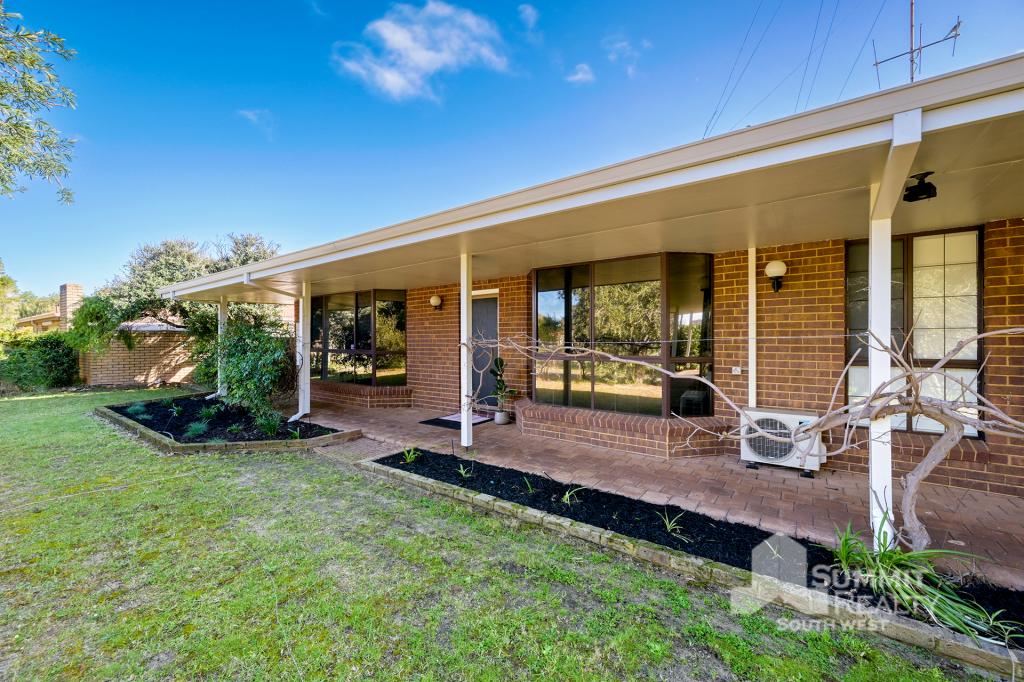 0
0
Similar properties For Rent nearby
See more properties for rent nearby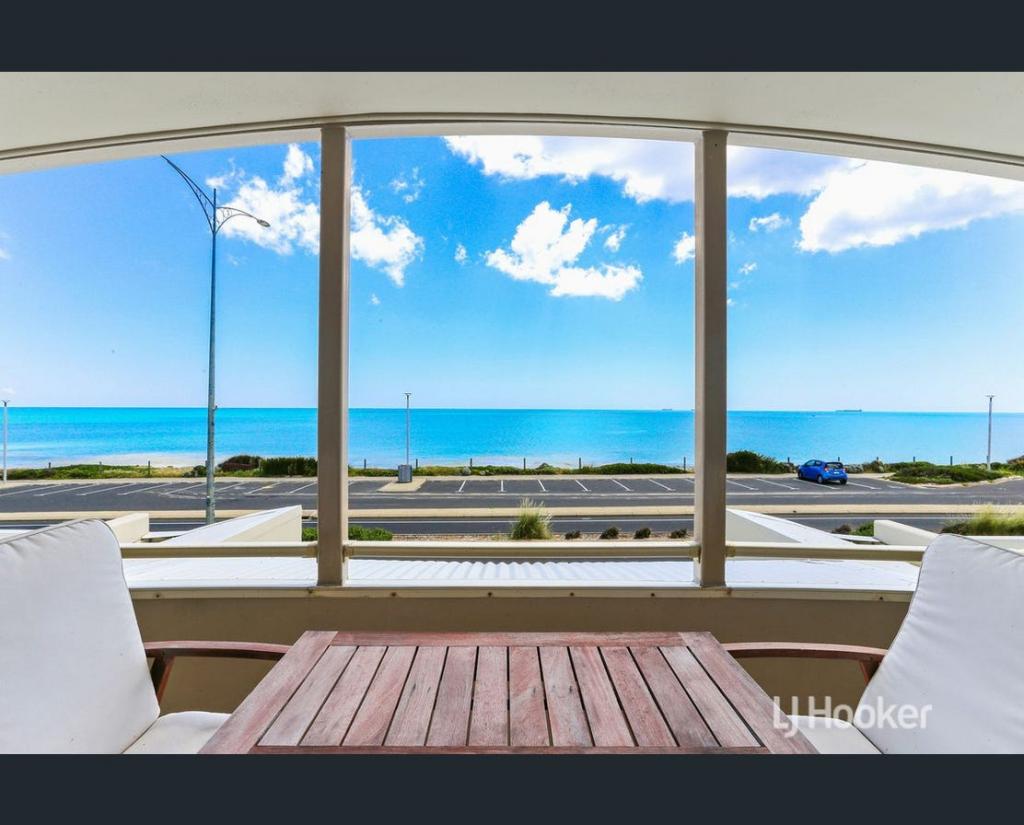 0
0
 0
0
About South Bunbury 6230
The size of South Bunbury is approximately 6.5 square kilometres. There are 15 parks, covering nearly 20.7% of the total area. The population of South Bunbury in 2016 was 8419 people. By 2021 the population was 8810 showing a population growth of 4.6% in the area during that time. The predominant age group in South Bunbury is 60-69 years. Households in South Bunbury are primarily childless couples and are likely to be repaying $1800 - $2399 per month on mortgage repayments. In general, people in South Bunbury work in a professional occupation.In 2021, 66.10% of the homes in South Bunbury were owner-occupied compared with 63.90% in 2016.
South Bunbury has 4,972 properties. Over the last 5 years, Houses in South Bunbury have seen a 88.90% increase in median value, while Units have seen a 89.10% increase. As at 31 August 2026:
- The median value for Houses in South Bunbury is $814,190 while the median value for Units is $562,420.
- Houses have a median rent of $650 while Units have a median rent of $610.
Suburb Insights for South Bunbury 6230
Market Insights
South Bunbury Trends for Houses
N/A
N/A
View TrendN/A
N/A
South Bunbury Trends for Units
N/A
N/A
View TrendN/A
N/A
Neighbourhood Insights
© Copyright 2026. RP Data Pty Ltd trading as Cotality (Cotality). All rights reserved. No reproduction, distribution, or transmission of the copyrighted materials is permitted. The information is deemed reliable but not guaranteed.
While Cotality uses commercially reasonable efforts to ensure the Cotality Data is current, Cotality does not warrant the accuracy, currency or completeness of the Cotality Data and to the full extent permitted by law excludes all loss or damage howsoever arising (including through negligence) in connection with the Cotality Data.
This product uses cookies and other similar technologies to improve and customise your browsing experience, to tailor content and adverts, and for analytics and metrics regarding visitor usage on this product and other media. We may share cookie and analytics information with third parties for the purposes of advertising. By continuing to use our website, you consent to cookies being used. View our Privacy Policy here.
X