
31 Mangini StreetMorley WA 6062
Property Details for 31 Mangini St, Morley
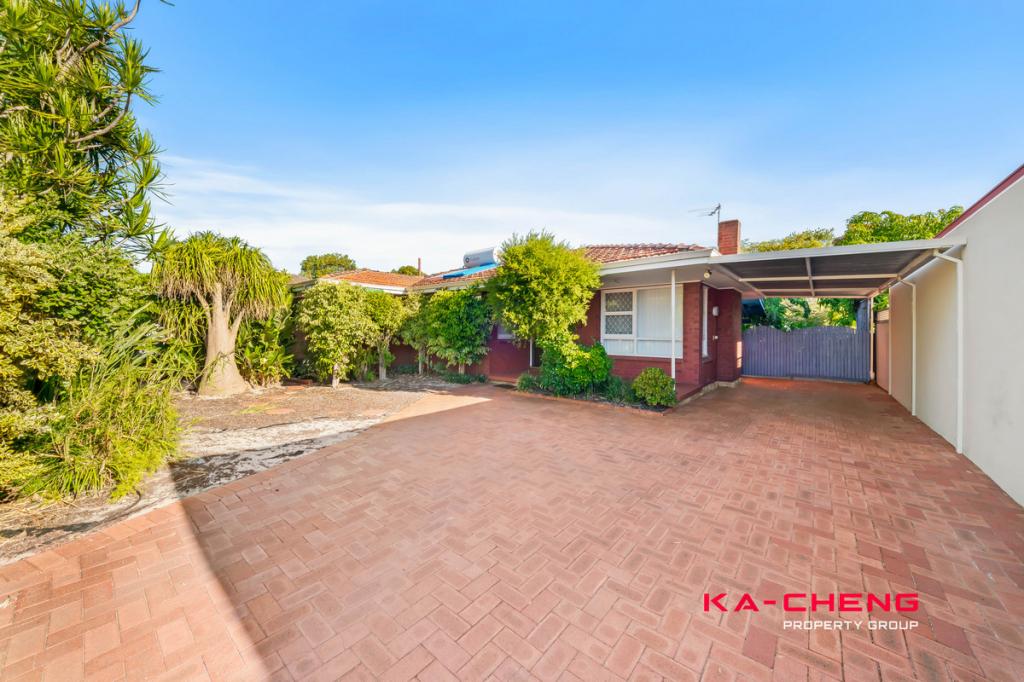
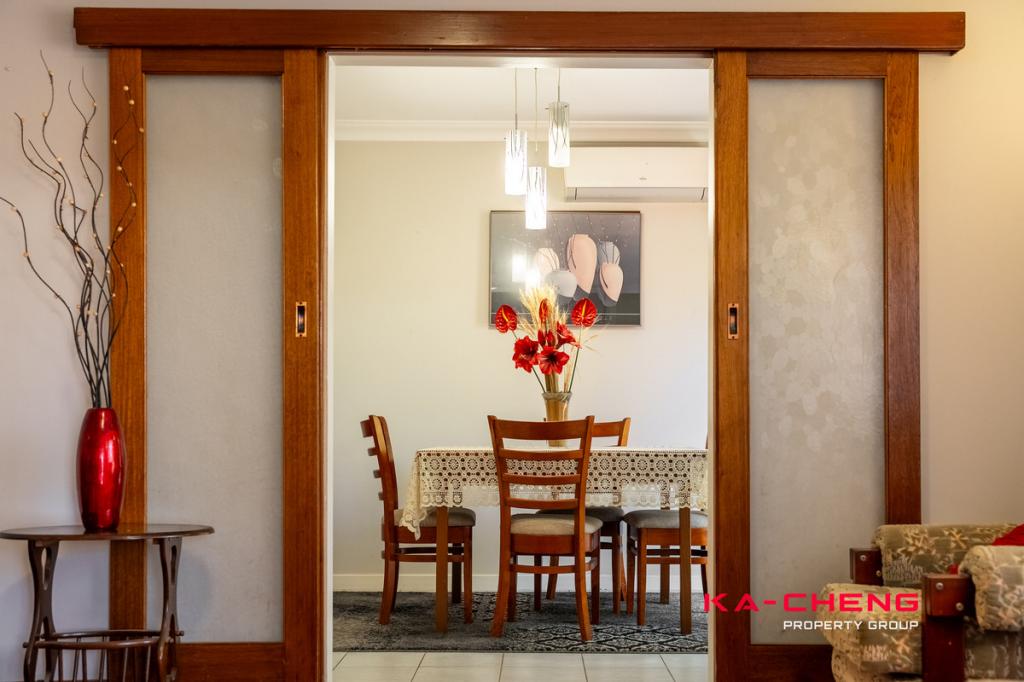
31 Mangini St, Morley is a 3 bedroom, 1 bathroom House with 1 parking spaces and was built in 1967. The property has a land size of 769m2 and floor size of 136m2. While the property is not currently for sale or for rent, it was last sold in December 2021.
Last Listing description (June 2017)
**Home Open this Saturday 17th of December 10:45am-11am**
Renovate or detonate, the choice is yours! A 769m2 POTENTIAL GOLDMINE in the Morley Structure Plan Rezoning Area, proposed to be change from R20/25 to R60/100. Initial enquiries with the council indicate this could currently be a retain and build, or could be ideal for two new side-by side blocks or homes (obviously subject to relevant approvals and regulations). Should the rezoning go through, the potential is far greater!
But one thing is for sure, this is a great location opposite Pat O'Hara Reserve with beautiful views across the park to the city, especially from a second storey.
Features at a Glance:
- 3 Bedroom, 1 Bathroom 1 1/2 Car Garage
- 769m2 Zoned R20/25 with wide 24.1m Frontage
- Potential Re-Zoning to R60/100 under Morley Structure Plan
- Directly opposite park with potential city views
- 5 minute walk to Morley Galleria across the park.
- Potential Rent of around $310 per week
- Council Rates: $1,493 p.a. Water Rates: $1,064 p.a.
Property History for 31 Mangini St, Morley, WA 6062
- 18 Dec 2021Sold for $769,500
- 01 Nov 2020Sold for $530,000
- 16 Dec 2016Sold for $532,000

Recent sales nearby
See more recent sales nearbySimilar properties For Sale nearby
See more properties for sale nearby
 0
0
 0
0 0
0Similar properties For Rent nearby
See more properties for rent nearby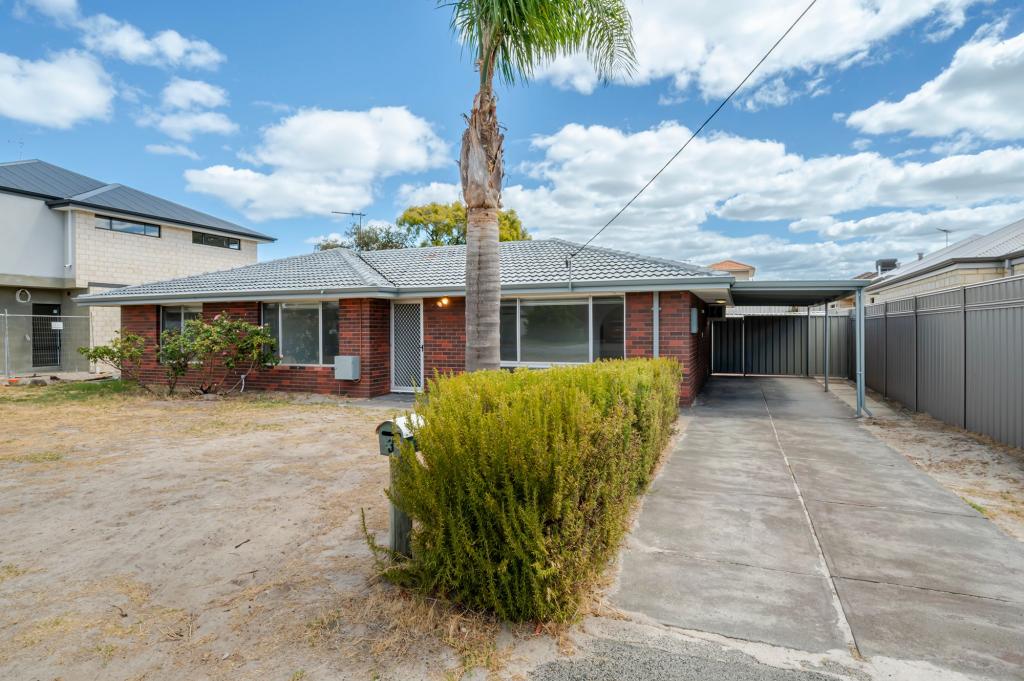 0
0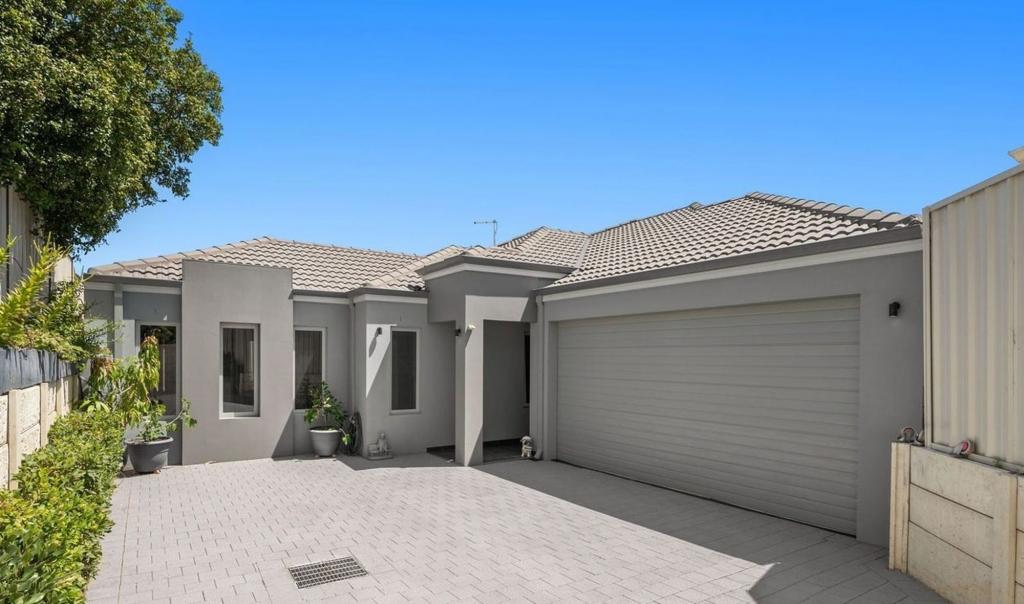 0
0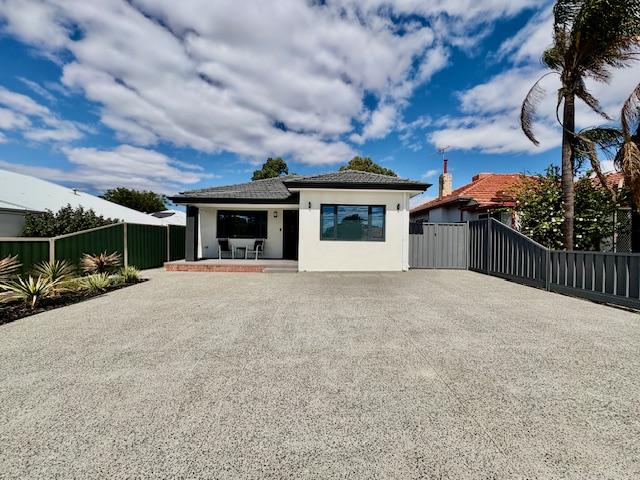 0
0About Morley 6062
The size of Morley is approximately 10.4 square kilometres. It has 46 parks covering nearly 8.8% of total area. The population of Morley in 2016 was 21530 people. By 2021 the population was 22539 showing a population growth of 4.7% in the area during that time. The predominant age group in Morley is 30-39 years. Households in Morley are primarily couples with children and are likely to be repaying $1800 - $2399 per month on mortgage repayments. In general, people in Morley work in a professional occupation.In 2021, 69.20% of the homes in Morley were owner-occupied compared with 68.80% in 2016.
Morley has 11,598 properties. Over the last 5 years, Houses in Morley have seen a 96.83% increase in median value, while Units have seen a 108.26% increase. As at 28 February 2026:
- The median value for Houses in Morley is $1,002,768 while the median value for Units is $724,200.
- Houses have a median rent of $730 while Units have a median rent of $650.
Suburb Insights for Morley 6062
Market Insights
Morley Trends for Houses
N/A
N/A
View TrendN/A
N/A
Morley Trends for Units
N/A
N/A
View TrendN/A
N/A
Neighbourhood Insights
© Copyright 2026. RP Data Pty Ltd trading as Cotality (Cotality). All rights reserved. No reproduction, distribution, or transmission of the copyrighted materials is permitted. The information is deemed reliable but not guaranteed.
While Cotality uses commercially reasonable efforts to ensure the Cotality Data is current, Cotality does not warrant the accuracy, currency or completeness of the Cotality Data and to the full extent permitted by law excludes all loss or damage howsoever arising (including through negligence) in connection with the Cotality Data.
This product uses cookies and other similar technologies to improve and customise your browsing experience, to tailor content and adverts, and for analytics and metrics regarding visitor usage on this product and other media. We may share cookie and analytics information with third parties for the purposes of advertising. By continuing to use our website, you consent to cookies being used. View our Privacy Policy here.
X