
7 Cole StreetManjimup WA 6258
Property Details for 7 Cole St, Manjimup
7 Cole St, Manjimup is a 3 bedroom, 2 bathroom House with 1 parking spaces and was built in 1980. The property has a land size of 911m2 and floor size of 125m2. While the property is not currently for sale or for rent, it was last sold in May 2003.
Last Listing description (April 2020)
Spacious light filled 3 x 2 home on a desirable quiet Street.
Modern renovated Kitchen with heaps of cupboard space and separate pantry.
Lovely renovated En suite.
Separate Dining room, living room and games area.
Picturesque rural outlook and nice low maintenance gardens all round.
Property History for 7 Cole St, Manjimup, WA 6258
- 10 Mar 2020Listed for Rent - Price not available
- 02 Oct 2011Listed for Rent - Price not available
- 13 May 2003Sold for $80,000

Recent sales nearby
See more recent sales nearbySimilar properties For Sale nearby
See more properties for sale nearby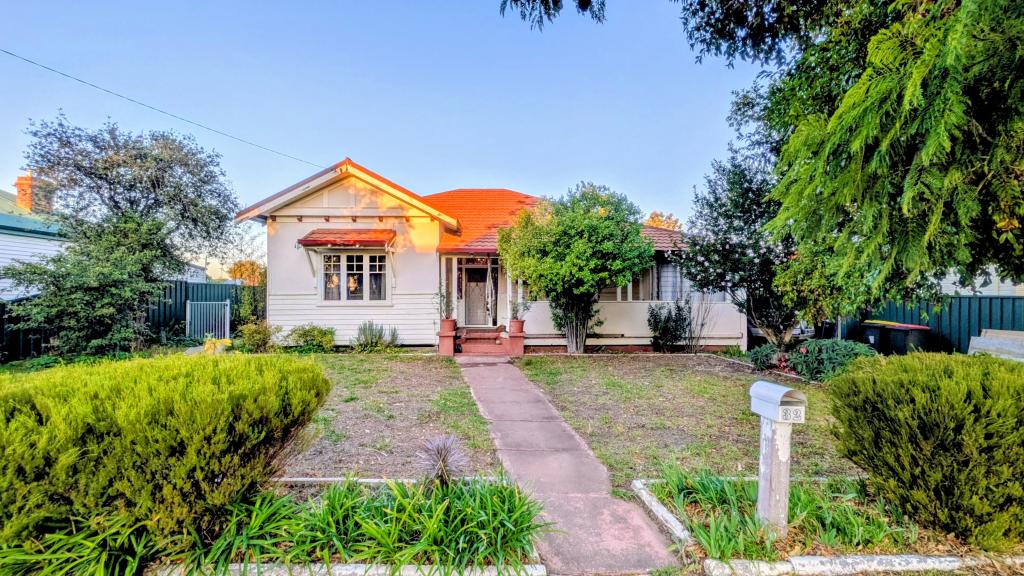 0
0
 0
0 0
0
About Manjimup 6258
The size of Manjimup is approximately 22.4 square kilometres. There are 15 parks, covering nearly 6.2% of the total area. The population of Manjimup in 2016 was 4349 people. By 2021 the population was 4279 showing a population decline of 1.6% in the area during that time. The predominant age group in Manjimup is 50-59 years. Households in Manjimup are primarily childless couples and are likely to be repaying $1000 - $1399 per month on mortgage repayments. In general, people in Manjimup work in a labourer occupation.In 2021, 63.00% of the homes in Manjimup were owner-occupied compared with 66.20% in 2016.
Manjimup has 2,546 properties. Over the last 5 years, Houses in Manjimup have seen a 132.51% increase in median value, while Units have seen a 79.79% increase. As at 30 June 2026:
- The median value for Houses in Manjimup is $551,929 while the median value for Units is $299,518.
- Houses have a median rent of $600 while Units have a median rent of $475.
Suburb Insights for Manjimup 6258
Market Insights
Manjimup Trends for Houses
N/A
N/A
View TrendN/A
N/A
Manjimup Trends for Units
N/A
N/A
View TrendN/A
N/A
Neighbourhood Insights
© Copyright 2026. RP Data Pty Ltd trading as Cotality (Cotality). All rights reserved. No reproduction, distribution, or transmission of the copyrighted materials is permitted. The information is deemed reliable but not guaranteed.
While Cotality uses commercially reasonable efforts to ensure the Cotality Data is current, Cotality does not warrant the accuracy, currency or completeness of the Cotality Data and to the full extent permitted by law excludes all loss or damage howsoever arising (including through negligence) in connection with the Cotality Data.
This product uses cookies and other similar technologies to improve and customise your browsing experience, to tailor content and adverts, and for analytics and metrics regarding visitor usage on this product and other media. We may share cookie and analytics information with third parties for the purposes of advertising. By continuing to use our website, you consent to cookies being used. View our Privacy Policy here.
X