
46 Thames DriveCape Burney WA 6532
Property Details for 46 Thames Dr, Cape Burney
46 Thames Dr, Cape Burney is a 3 bedroom, 0 bathroom House and was built in 2015. The property has a land size of 596m2 and floor size of 166m2. While the property is not currently for sale or for rent, it was last sold in October 2014.
Last Listing description (October 2014)
What a lifestyle!
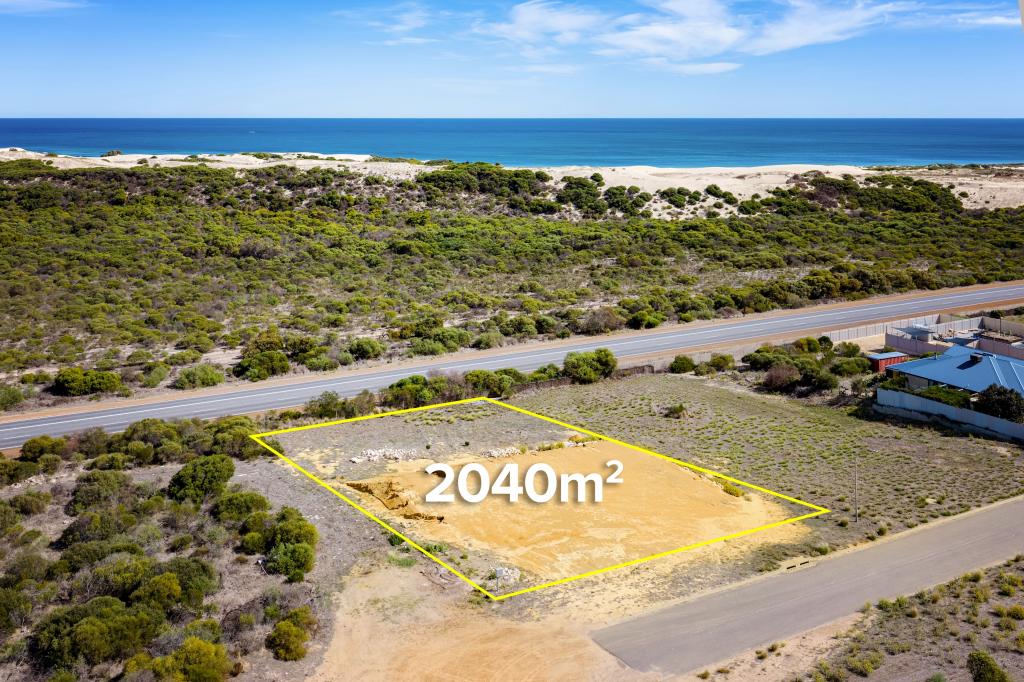
Fishing, surfing, sand dunes, Greenough river/river mouth, walk trails, kids play ground & rowing club. You will never have a dull moment. All this approx. 7 minutes' drive out of the CBD.
This 596m2 fully fenced elevated block is nestled nicely in the cultersac of Thames Drive and it could be the blank canvas of your new home.
Call Exclusive listing agent Shantell Kupsch on 0428 230 287
Property History for 46 Thames Dr, Cape Burney, WA 6532
- 10 Oct 2014Sold for $84,000
- 19 Feb 2014Listed for Sale $90,000-$105,000
- 05 Feb 2012Sold for $110,000

Recent sales nearby
See more recent sales nearbySimilar properties For Sale nearby
See more properties for sale nearby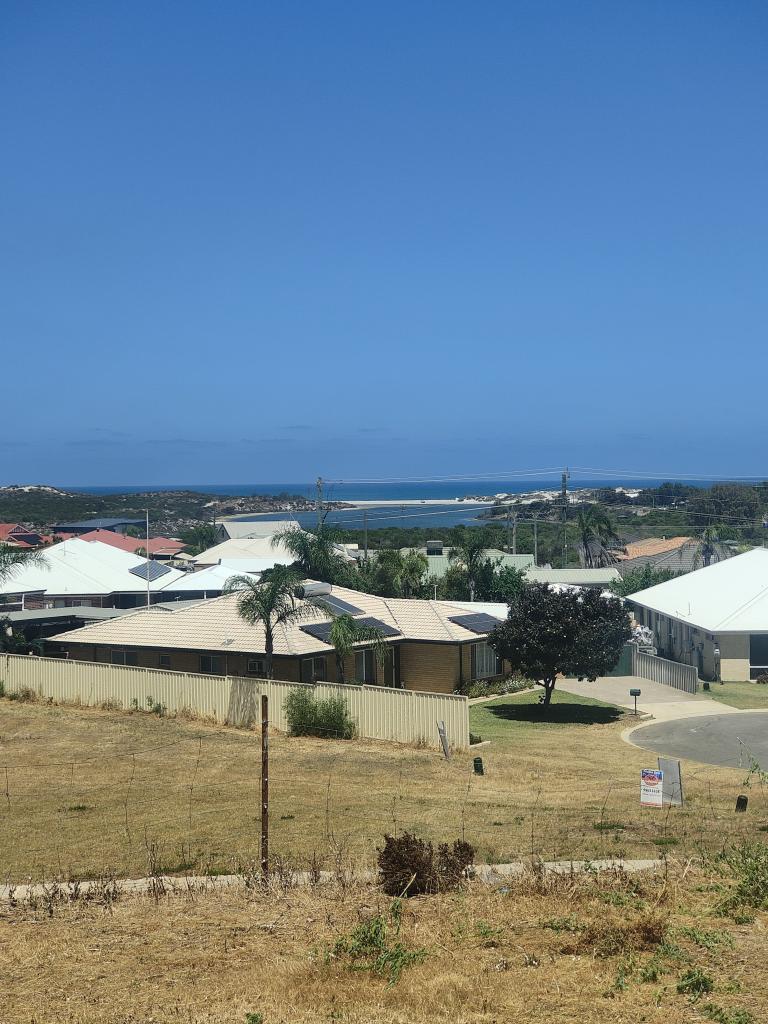 0
0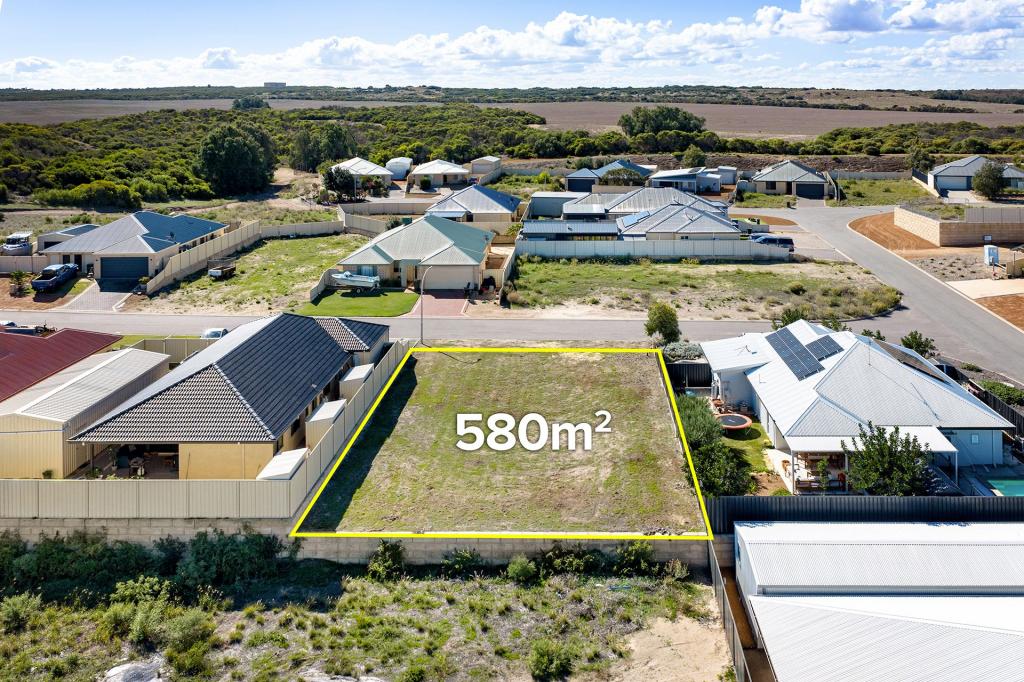 0
0
 0
0
 0
0About Cape Burney 6532
The size of Cape Burney is approximately 19.2 square kilometres. There is 1 park, covering nearly 0.1% of the total area. The population of Cape Burney in 2016 was 500 people. By 2021 the population was 538 showing a population growth of 7.6% in the area during that time. The predominant age group in Cape Burney is 50-59 years. Households in Cape Burney are primarily childless couples and are likely to be repaying $1800 - $2399 per month on mortgage repayments. In general, people in Cape Burney work in a trades occupation.In 2021, 73.50% of the homes in Cape Burney were owner-occupied compared with 73.30% in 2016.
Cape Burney has 320 properties. Over the last 5 years, Houses in Cape Burney have seen a 91.99% increase in median value. As at 31 May 2026:
- The median value for Houses in Cape Burney is $602,392.
- Houses have a median rent of $520.
Suburb Insights for Cape Burney 6532
Market Insights
Cape Burney Trends for Houses
N/A
N/A
View TrendN/A
N/A
Cape Burney Trends for Units
N/A
N/A
View TrendN/A
N/A
Neighbourhood Insights
© Copyright 2026. RP Data Pty Ltd trading as Cotality (Cotality). All rights reserved. No reproduction, distribution, or transmission of the copyrighted materials is permitted. The information is deemed reliable but not guaranteed.
While Cotality uses commercially reasonable efforts to ensure the Cotality Data is current, Cotality does not warrant the accuracy, currency or completeness of the Cotality Data and to the full extent permitted by law excludes all loss or damage howsoever arising (including through negligence) in connection with the Cotality Data.
This product uses cookies and other similar technologies to improve and customise your browsing experience, to tailor content and adverts, and for analytics and metrics regarding visitor usage on this product and other media. We may share cookie and analytics information with third parties for the purposes of advertising. By continuing to use our website, you consent to cookies being used. View our Privacy Policy here.
X