165 Bannister RoadCanning Vale WA 6155
Property Details for 165 Bannister Rd, Canning Vale
Last Listing description (July 2021)
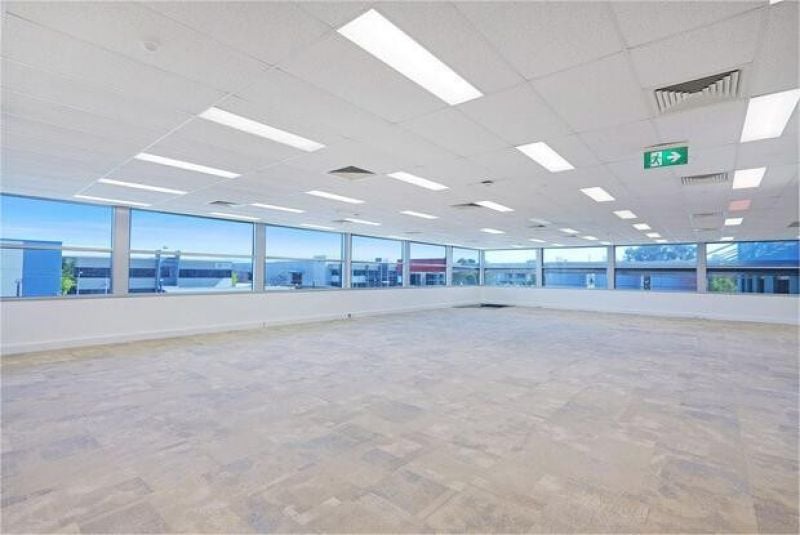
This fully fitted out 130sqm office space is suitable for medical use or professional office. Situated in a prominent corner location at the intersection of Willeri Drive and Bannister, and is conveniently situated just off Roe Highway. This property offers great exposure with approximately 20,700 vehicles passing by daily. Property Features: - Fully Fitted Out - Excellent parking with plenty of onsite parking available - Easily Accessible - Zoned ' General Industry' - Available NowFor more information or to arrange an inspection, please contact Gary today...
Property History for 165 Bannister Rd, Canning Vale, WA 6155
- 18 Jun 2020Listed for Rent $35,000 / year
- 18 Dec 2019Listed for Rent $41,475 / year
- 23 Mar 2016Sold for $4,100,000
Recent sales nearby
See more recent sales nearbySimilar properties For Sale nearby
See more properties for sale nearby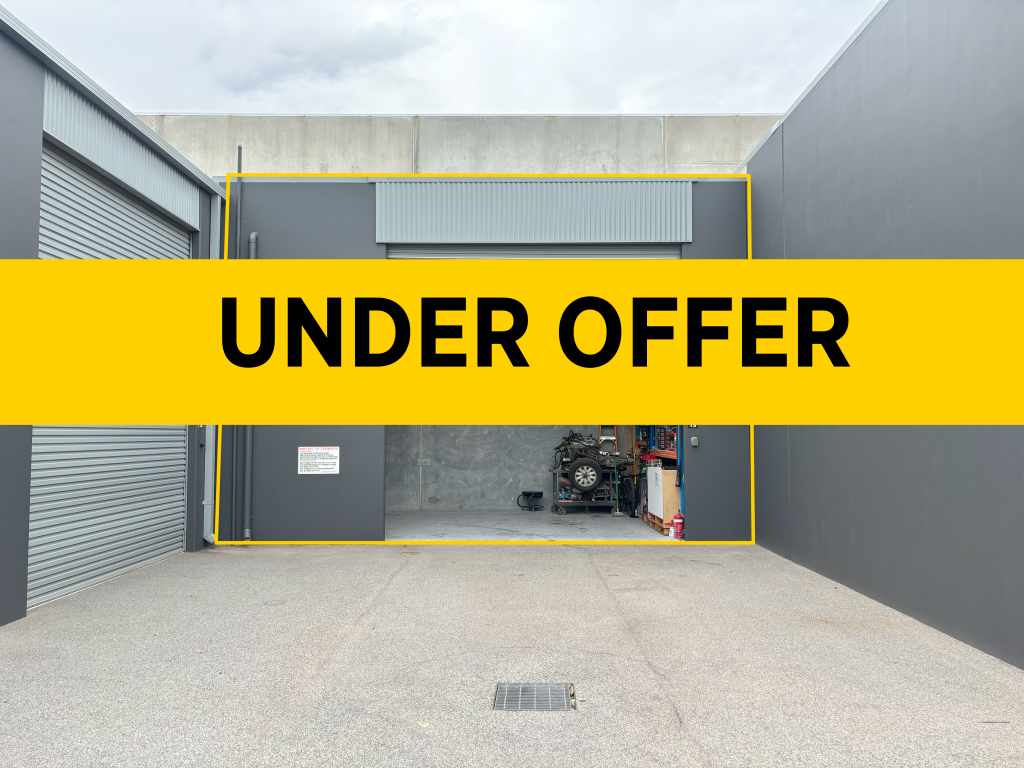

Similar properties For Rent nearby
See more properties for rent nearby

About Canning Vale 6155
The size of Canning Vale is approximately 25.4 square kilometres. It has 71 parks covering nearly 17.1% of total area. The population of Canning Vale in 2011 was 30,665 people. By 2016 the population was 33,069 showing a population growth of 7.8% in the area during that time. The predominant age group in Canning Vale is 40-49 years. Households in Canning Vale are primarily couples with children and are likely to be repaying $1800 - $2399 per month on mortgage repayments. In general, people in Canning Vale work in a professional occupation. In 2011, 82.8% of the homes in Canning Vale were owner-occupied compared with 81% in 2016.
Canning Vale has 13,499 properties. Over the last 5 years, Houses in Canning Vale have seen a 76.96% increase in median value, while Units have seen a 106.14% increase. As at 30 April 2025:
- The median value for Houses in Canning Vale is $942,988 while the median value for Units is $656,611.
- Houses have a median rent of $760 while Units have a median rent of $665.
What's around 165 Bannister Rd, Canning Vale


Suburb Insights for Canning Vale 6155
Market Insights
Canning Vale Trends for Houses
$943k
7.32%
View Trend$760/W
4.39%
Canning Vale Trends for Units
$657k
23.75%
View Trend$665/W
5.46%
Neighbourhood Insights
Age
Population 33,069
0-9
14%
10-19
15%
20-29
15%
30-39
15%
40-49
16%
50-59
13%
60-69
8%
70-79
3%
80-89
1%
Household Structure
Occupancy
© Copyright 2025 RP Data Pty Ltd trading as CoreLogic Asia Pacific (CoreLogic). All rights reserved.
This product uses cookies and other similar technologies to improve and customise your browsing experience, to tailor content and adverts, and for analytics and metrics regarding visitor usage on this product and other media. We may share cookie and analytics information with third parties for the purposes of advertising. By continuing to use our website, you consent to cookies being used. View our Privacy Policy here.
X