
176 Kiewa Valley HighwayTawonga South VIC 3698
Property Details for 176 Kiewa Valley Hwy, Tawonga South
176 Kiewa Valley Hwy, Tawonga South is a 3 bedroom, 2 bathroom House with 2 parking spaces and was built in 2012. The property has a land size of 620m2 and floor size of 142m2. While the property is not currently for sale or for rent, it was last sold in July 2019.
Last Listing description (October 2011)
Huge Views
Within easy distance from the shops and restaurants of the area this allotment would offer the astute purchaser the ability to establish a dream home or possibly some commercial venture. With dual access the ability to drive straight through could be an advantage to this 1100sm block.$138,000
Property History for 176 Kiewa Valley Hwy, Tawonga South, VIC 3698
- 11 Jul 2019Sold for $527,000
- 15 Jun 2012Sold for $123,500
- 18 Jul 2010Listed for Sale 138000

Recent sales nearby
See more recent sales nearby
Similar properties For Sale nearby
See more properties for sale nearby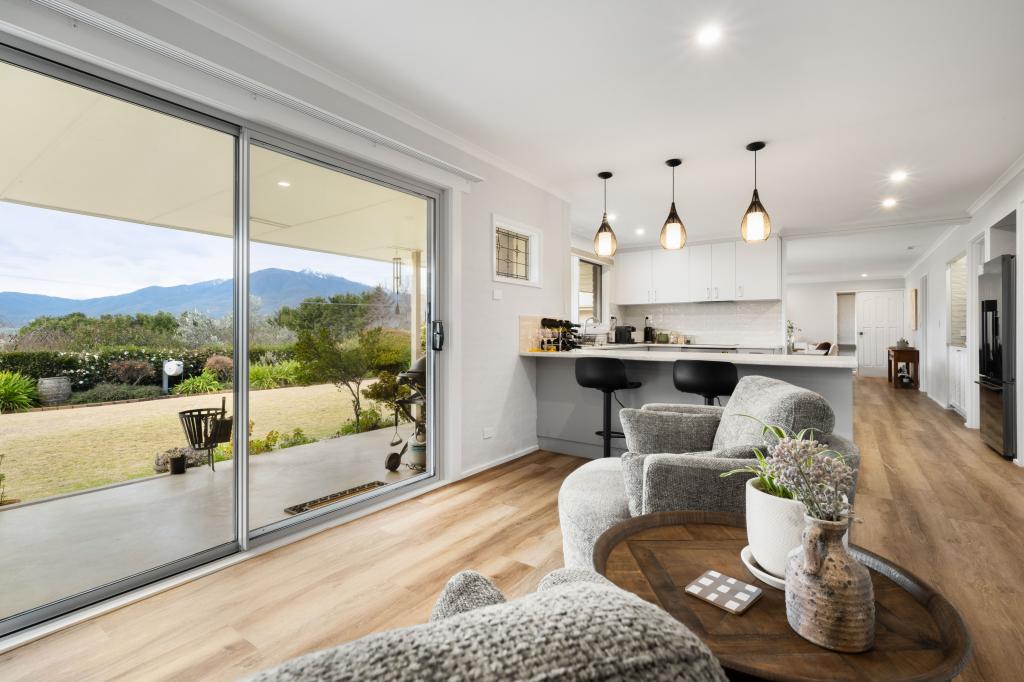 0
0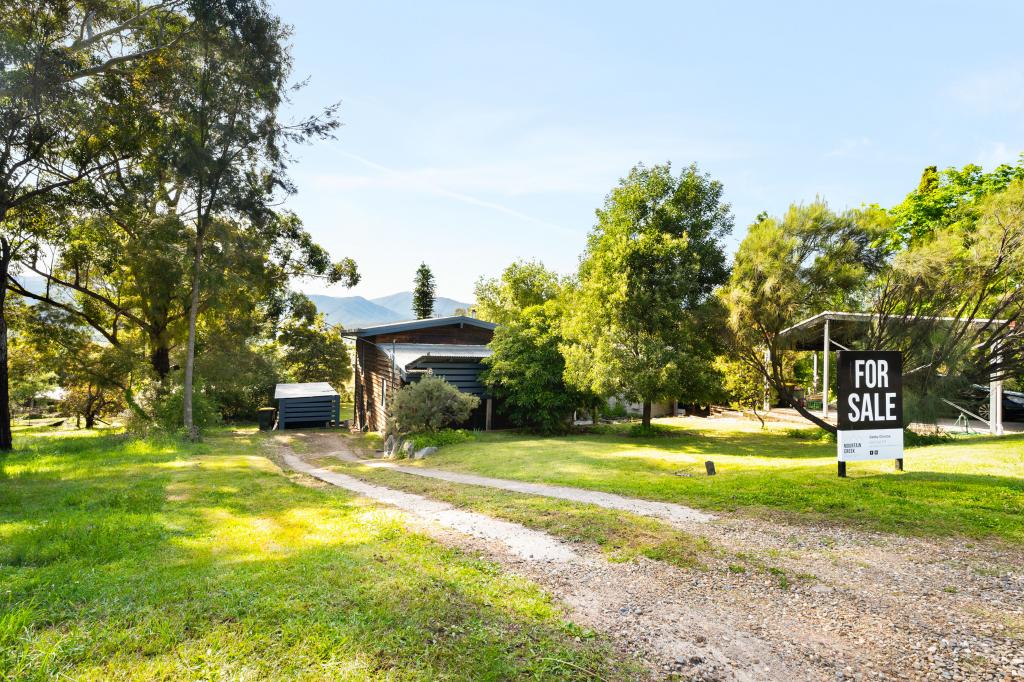 0
0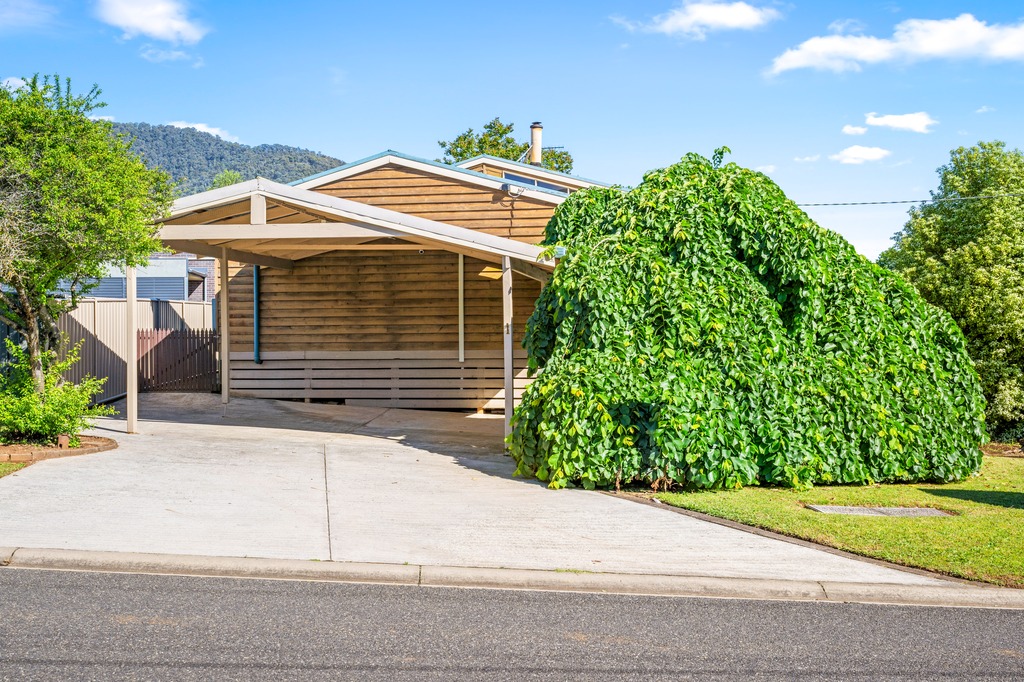 0
0About Tawonga South 3698
The size of Tawonga South is approximately 48.7 square kilometres. It has 3 parks covering nearly 85.7% of total area. The population of Tawonga South in 2016 was 862 people. By 2021 the population was 1012 showing a population growth of 17.4% in the area during that time. The predominant age group in Tawonga South is 60-69 years. Households in Tawonga South are primarily childless couples and are likely to be repaying $1000 - $1399 per month on mortgage repayments. In general, people in Tawonga South work in a professional occupation.In 2021, 85.30% of the homes in Tawonga South were owner-occupied compared with 83.60% in 2016.
Tawonga South has 769 properties. Over the last 5 years, Houses in Tawonga South have seen a 69.32% increase in median value, while Units have seen a 47.95% increase. As at 30 November 2025:
- The median value for Houses in Tawonga South is $710,498 while the median value for Units is $634,909.
- Houses have a median rent of $480.
Suburb Insights for Tawonga South 3698
Market Insights
Tawonga South Trends for Houses
N/A
N/A
View TrendN/A
N/A
Tawonga South Trends for Units
N/A
N/A
View TrendN/A
N/A
Neighbourhood Insights
© Copyright 2025. RP Data Pty Ltd trading as Cotality (Cotality). All rights reserved. No reproduction, distribution, or transmission of the copyrighted materials is permitted. The information is deemed reliable but not guaranteed.
While Cotality uses commercially reasonable efforts to ensure the Cotality Data is current, Cotality does not warrant the accuracy, currency or completeness of the Cotality Data and to the full extent permitted by law excludes all loss or damage howsoever arising (including through negligence) in connection with the Cotality Data.
This product uses cookies and other similar technologies to improve and customise your browsing experience, to tailor content and adverts, and for analytics and metrics regarding visitor usage on this product and other media. We may share cookie and analytics information with third parties for the purposes of advertising. By continuing to use our website, you consent to cookies being used. View our Privacy Policy here.
X