
11 Currajong StreetSt Albans VIC 3021
Property Details for 11 Currajong St, St Albans
11 Currajong St, St Albans is a 3 bedroom, 1 bathroom House with 2 parking spaces and was built in 1980. The property has a land size of 534m2 and floor size of 101m2. While the property is not currently for sale or for rent, it was last sold in June 2022.
Last Listing description (July 2025)
This well-maintained 3-bedroom home offers comfort, space, and incredible convenience in a sought-after St Albans location.Property features include: Three generous bedrooms Central bathroom with toilet, plus additional second toilet Open-plan living and connecting dining areas Split system heating and cooling for year-round comfort Spacious double garagePrime Location: Only moments from Sunshine Hospital, Ginnifer Station, and easy freeway access, making commuting a breeze. Enjoy being close to schools, parks, and local shopping options.A perfect fit for families, tradies or anyone needing extra space and flexibility.Inspect today - homes in this location don't last long!Applications are to be completed & submitted online via 'realestate.com.au' Apply code will be provided after inspecting the property.DISCLAIMER: Every precaution has been taken to establish the accuracy of the above information, but it does not constitute any representation by the landlord/agent and agency
Property History for 11 Currajong St, St Albans, VIC 3021
- 16 Jul 2025Listed for Rent - Price not available
- 18 Jun 2022Sold for $675,000
- 23 May 2022Listed for Sale Contact Agent

Recent sales nearby
See more recent sales nearbySimilar properties For Sale nearby
See more properties for sale nearby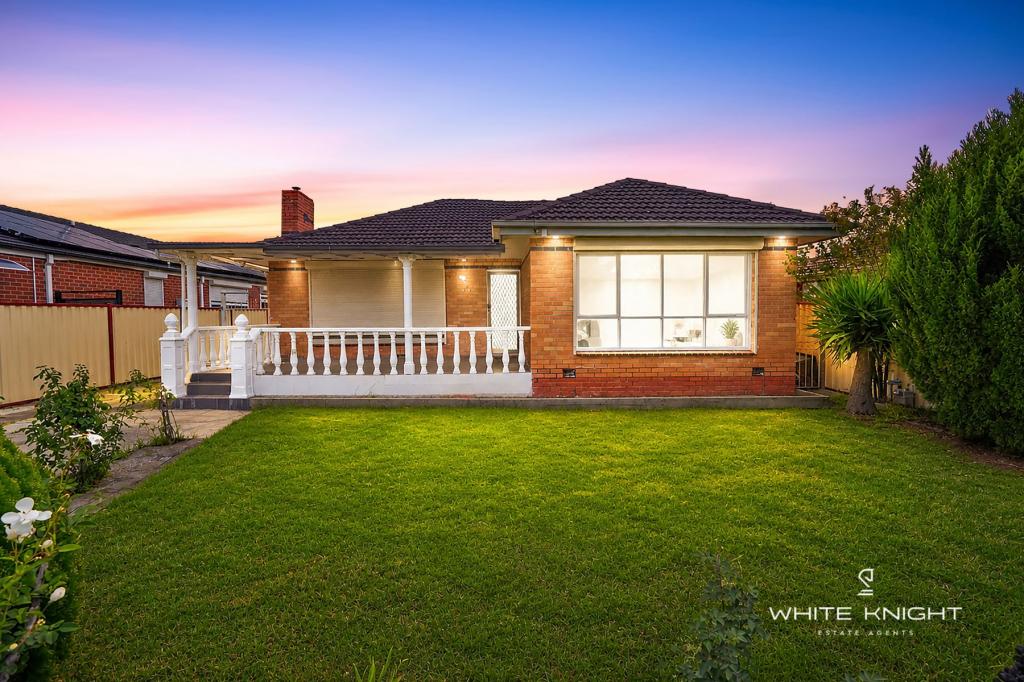 0
0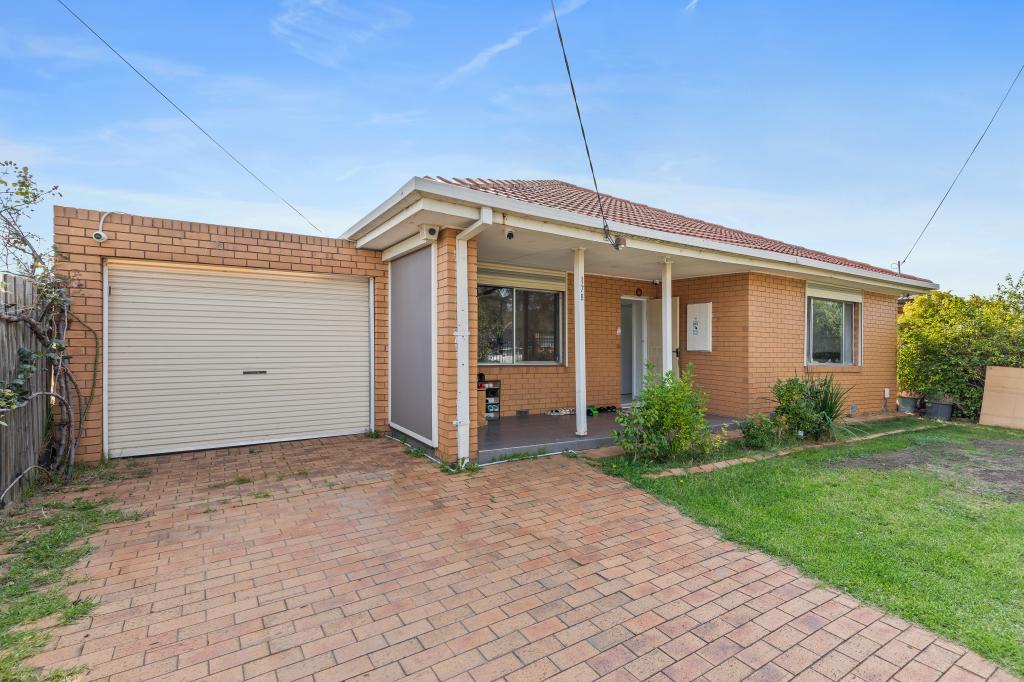 0
0 0
0Similar properties For Rent nearby
See more properties for rent nearby 0
0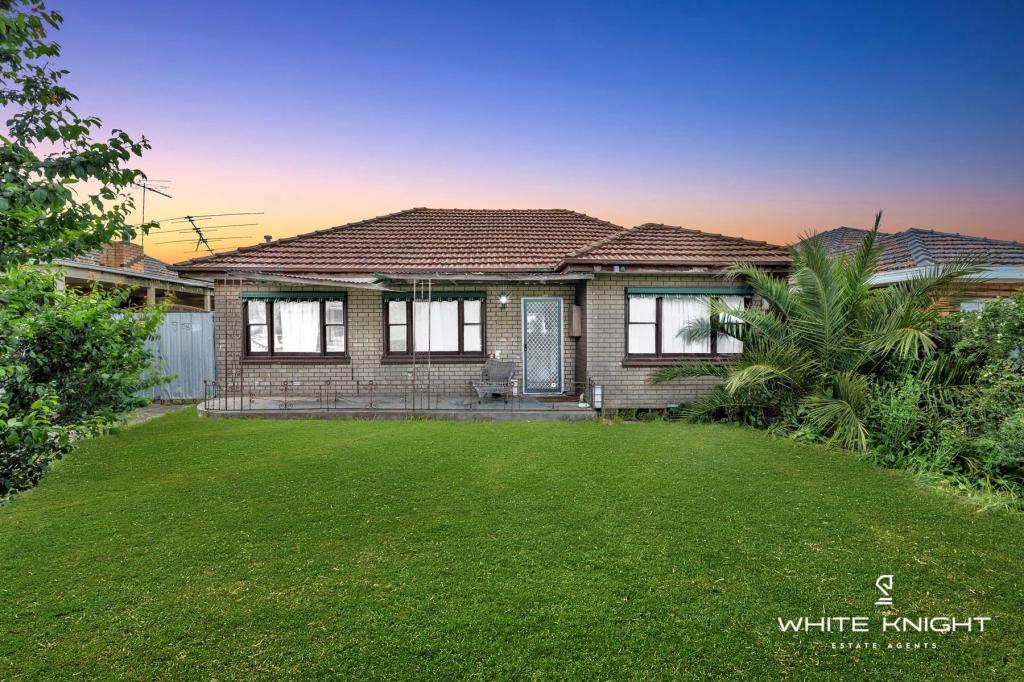 0
0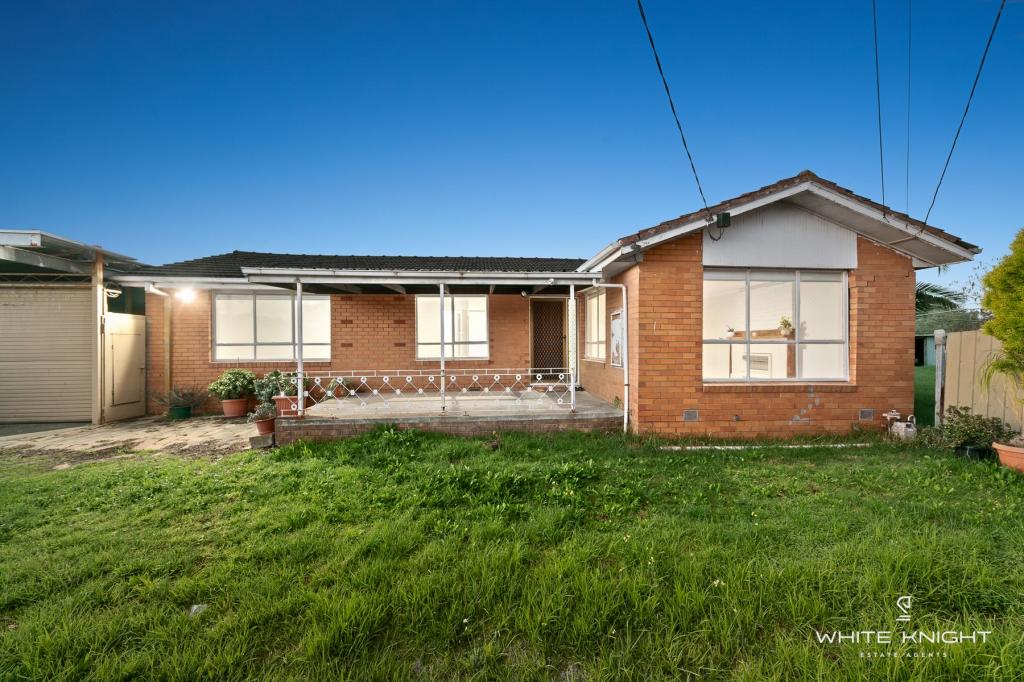 0
0About St Albans 3021
The size of St Albans is approximately 13.0 square kilometres. There are 36 parks, covering nearly 8.4% of the total area. The population of St Albans in 2016 was 37309 people. By 2021 the population was 38042 showing a population growth of 2.0% in the area during that time. The predominant age group in St Albans is 20-29 years. Households in St Albans are primarily couples with children and are likely to be repaying $1800 - $2399 per month on mortgage repayments. In general, people in St Albans work in a labourer occupation.In 2021, 59.10% of the homes in St Albans were owner-occupied compared with 60.50% in 2016.
St Albans has 17,237 properties. Over the last 5 years, Houses in St Albans have seen a 10.11% increase in median value, while Units have seen a 20.39% increase. As at 31 May 2026:
- The median value for Houses in St Albans is $731,405 while the median value for Units is $547,329.
- Houses have a median rent of $500 while Units have a median rent of $450.
Suburb Insights for St Albans 3021
Market Insights
St Albans Trends for Houses
N/A
N/A
View TrendN/A
N/A
St Albans Trends for Units
N/A
N/A
View TrendN/A
N/A
Neighbourhood Insights
© Copyright 2026. RP Data Pty Ltd trading as Cotality (Cotality). All rights reserved. No reproduction, distribution, or transmission of the copyrighted materials is permitted. The information is deemed reliable but not guaranteed.
While Cotality uses commercially reasonable efforts to ensure the Cotality Data is current, Cotality does not warrant the accuracy, currency or completeness of the Cotality Data and to the full extent permitted by law excludes all loss or damage howsoever arising (including through negligence) in connection with the Cotality Data.
This product uses cookies and other similar technologies to improve and customise your browsing experience, to tailor content and adverts, and for analytics and metrics regarding visitor usage on this product and other media. We may share cookie and analytics information with third parties for the purposes of advertising. By continuing to use our website, you consent to cookies being used. View our Privacy Policy here.
X