
3 Tilly PlaceLynbrook VIC 3975
Property Details for 3 Tilly Pl, Lynbrook
3 Tilly Pl, Lynbrook is a 4 bedroom, 2 bathroom House with 2 parking spaces and was built in 2012. The property has a land size of 483m2 and floor size of 210m2. While the property is not currently for sale or for rent, it was last sold in June 2016.
Last Listing description (July 2026)
Set in a quiet street and close to all amenities, this immaculately presented family home boasts spacious open plan living throughout.
This home offers multiple living areas, study and four good sized bedrooms with built in robes, the master with full ensuite and walk in robe. There is a second modern central bathroom with shower and bath, as well as separate toilet, as well as separate laundry with ample shelving and storage.
The well-appointed centrally located open plan kitchen with stainless steel appliances, caesar stone bench tops, walk in pantry and dishwasher overlooks the family/dining area, which leads on to the rumpus/theatre room. There's also access to the private undercover decking area for outdoor entertainment.
Other features include LED downlights throughout, ducted heating and split system air conditioning, double remote garage with internal access, low maintenance gardens and more. Don't miss out!
RENT PER CALENDAR MONTH = $2,976.00
BOND = $2,976.00
Property History for 3 Tilly Pl, Lynbrook, VIC 3975
- 18 Sep 2025Listed for Rent $685 / week
- 21 Aug 2023Listed for Rent $660 / week
- 15 Aug 2022Listed for Rent $595 / week

Recent sales nearby
See more recent sales nearbySimilar properties For Sale nearby
See more properties for sale nearby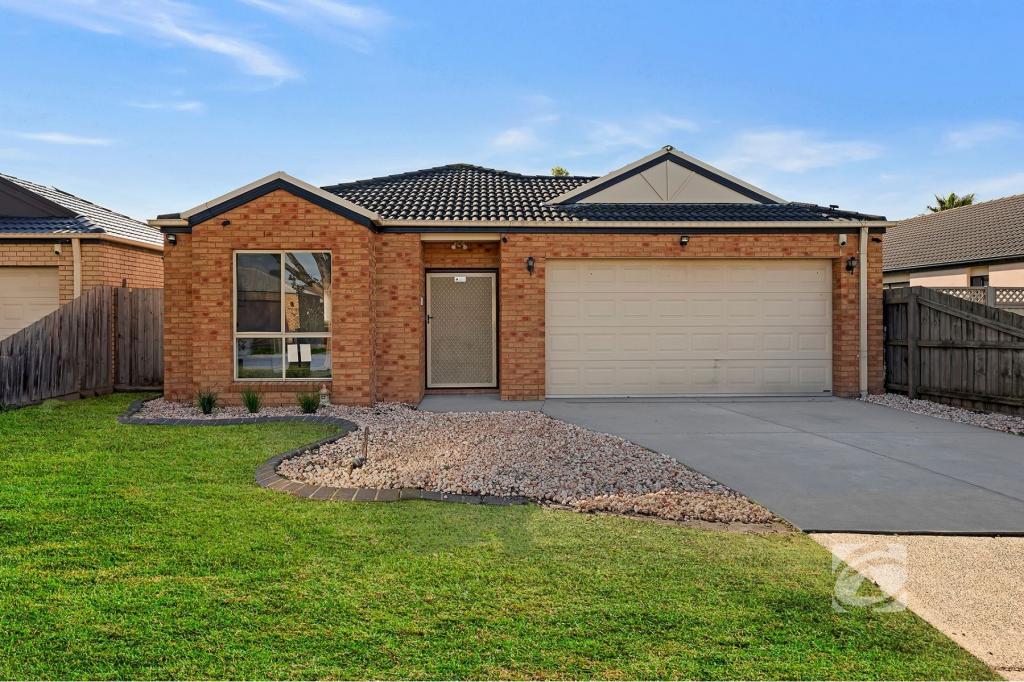 0
0 0
0
 0
0Similar properties For Rent nearby
See more properties for rent nearby 0
0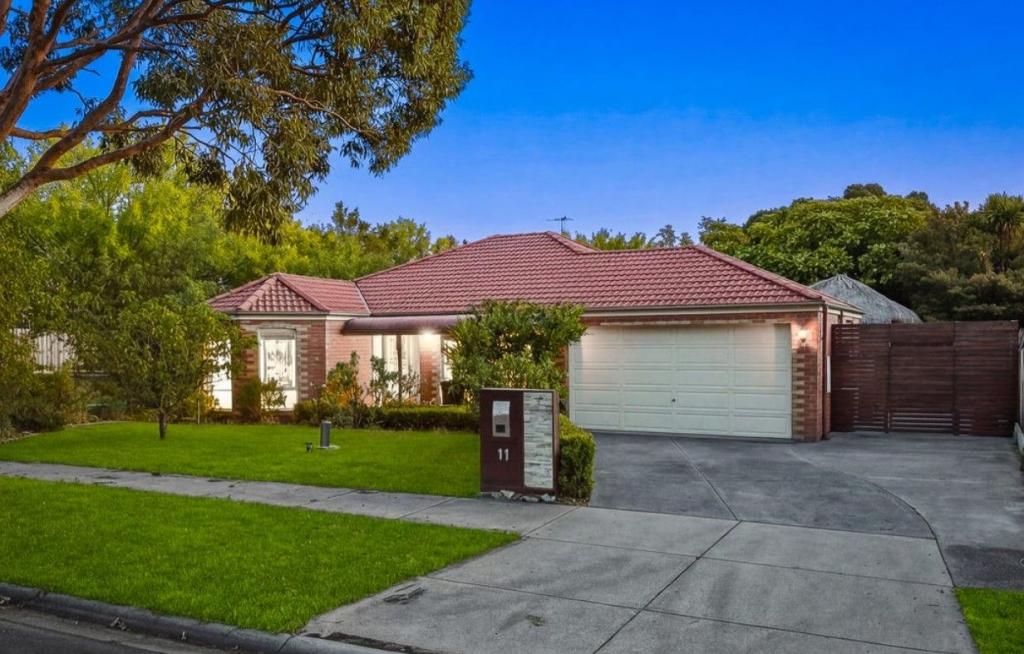 0
0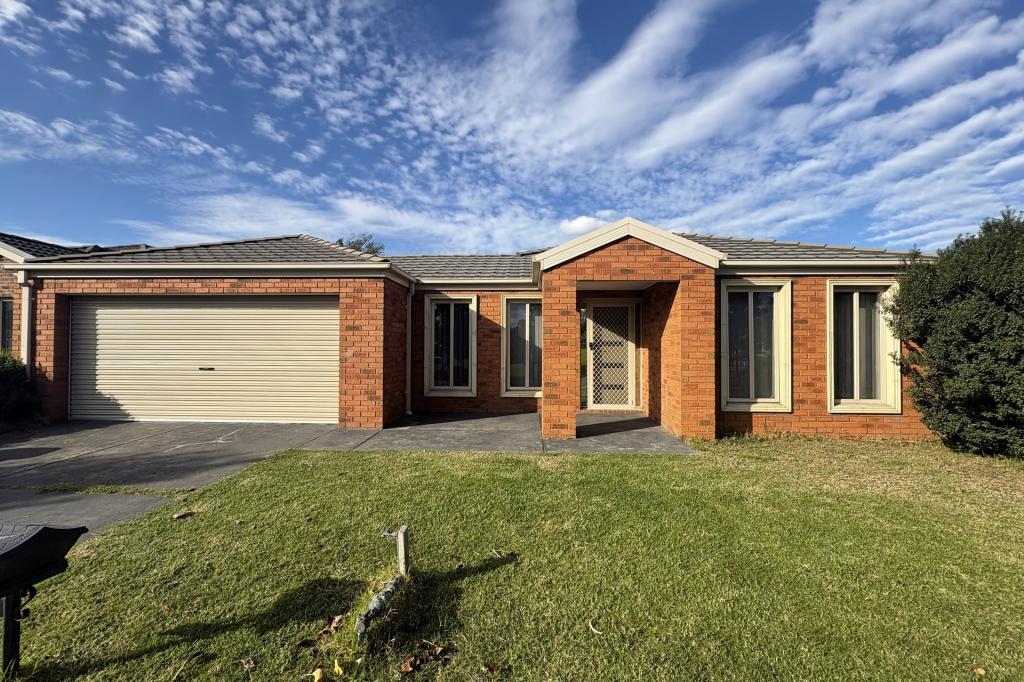 0
0About Lynbrook 3975
The size of Lynbrook is approximately 4.1 square kilometres. There are 19 parks, covering nearly 13.0% of the total area. The population of Lynbrook in 2016 was 8519 people. By 2021 the population was 9121 showing a population growth of 7.1% in the area during that time. The predominant age group in Lynbrook is 10-19 years. Households in Lynbrook are primarily couples with children and are likely to be repaying $1800 - $2399 per month on mortgage repayments. In general, people in Lynbrook work in a professional occupation.In 2021, 77.20% of the homes in Lynbrook were owner-occupied compared with 80.50% in 2016.
Lynbrook has 3,251 properties. Over the last 5 years, Houses in Lynbrook have seen a 17.89% increase in median value, while Units have seen a 25.64% increase. As at 30 June 2026:
- The median value for Houses in Lynbrook is $961,402 while the median value for Units is $673,901.
- Houses have a median rent of $625 while Units have a median rent of $595.
Suburb Insights for Lynbrook 3975
Market Insights
Lynbrook Trends for Houses
N/A
N/A
View TrendN/A
N/A
Lynbrook Trends for Units
N/A
N/A
View TrendN/A
N/A
Neighbourhood Insights
© Copyright 2026. RP Data Pty Ltd trading as Cotality (Cotality). All rights reserved. No reproduction, distribution, or transmission of the copyrighted materials is permitted. The information is deemed reliable but not guaranteed.
While Cotality uses commercially reasonable efforts to ensure the Cotality Data is current, Cotality does not warrant the accuracy, currency or completeness of the Cotality Data and to the full extent permitted by law excludes all loss or damage howsoever arising (including through negligence) in connection with the Cotality Data.
This product uses cookies and other similar technologies to improve and customise your browsing experience, to tailor content and adverts, and for analytics and metrics regarding visitor usage on this product and other media. We may share cookie and analytics information with third parties for the purposes of advertising. By continuing to use our website, you consent to cookies being used. View our Privacy Policy here.
X