
9 Belmar StreetCranbourne VIC 3977


Property Details for 9 Belmar St, Cranbourne
9 Belmar St, Cranbourne is a 4 bedroom, 2 bathroom House with 4 parking spaces. The property has a land size of 604m2. While the property is not currently for sale or for rent, it was last sold in November 2025. There are other 4 bedroom House sold in Cranbourne in the last 12 months.
Last Listing description (November 2025)
Beautifully presented and ideally located, this charming family home offers a perfect blend of comfort, space, and potential in one of Cranbourne’s most convenient pockets. Just a short stroll to Cranbourne Train Station, main street shopping precinct, local schools, and serene nature reserves — this property delivers lifestyle, convenience, and versatility.
Set on a generous 604sqm (approx.) block, the home features four spacious bedrooms with built-in robes, including a master suite with private ensuite. The bright and open living area provides an inviting space for family gatherings and seamlessly connects to the updated kitchen and dining area for effortless everyday living.
Additional highlights include two gas heating units, window A/C in the lounge, ceiling fans, 8 solar panels, and stylish floating floorboards and tiles throughout. The large double garage/shed offers excellent flexibility, with space for up to four cars, a workshop, or a home office setup.
The covered outdoor entertainment area is perfect for year-round enjoyment, while the fully fenced front and back yards provide a safe and private space for children and pets.
With the exciting potential for future subdivision (STCA), this home represents not only a comfortable family residence but also a smart investment opportunity in a highly sought-after location.
A home that combines warmth, practicality, and potential — ready to welcome its next proud owner.
Photo ID required at all open for inspections.
Disclaimer: We have, in preparing this document, used our best endeavours to ensure that the information contained in this document is true and accurate, but accept no responsibility and disclaim all liability in respect to any errors, omissions, inaccuracies or misstatements in this document. Prospective purchasers should make their own enquiries to verify the information contained in this document. Purchasers should make their own enquiries and refer to the due diligence checklist provided by Consumer Affairs. Click on the link for a copy of the due diligence checklist from Consumer Affairs. http://www.consumer.vic.gov.au/duediligencechecklist
Property History for 9 Belmar St, Cranbourne, VIC 3977
- 19 Nov 2025Sold for $737,000
- 06 Nov 2025Listed for Sale AUCTION
- 31 Jan 2024Listed for Rent $480 / week

Recent sales nearby
See more recent sales nearby
Similar properties For Sale nearby
See more properties for sale nearby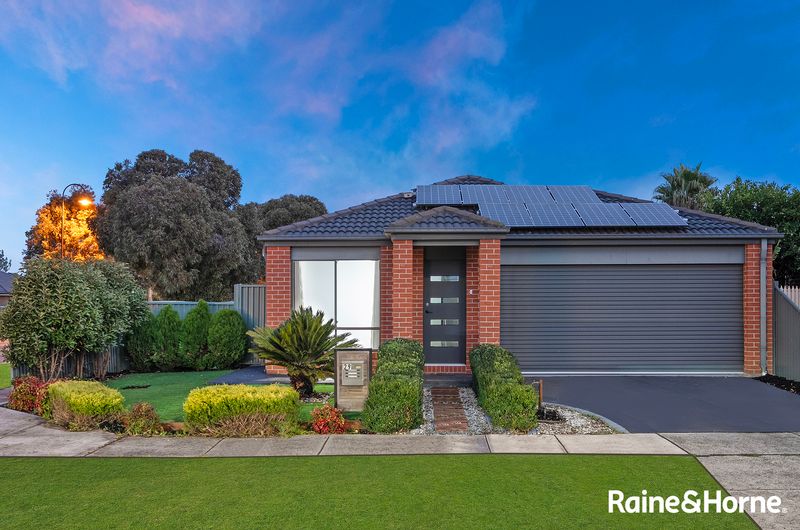 0
0 0
0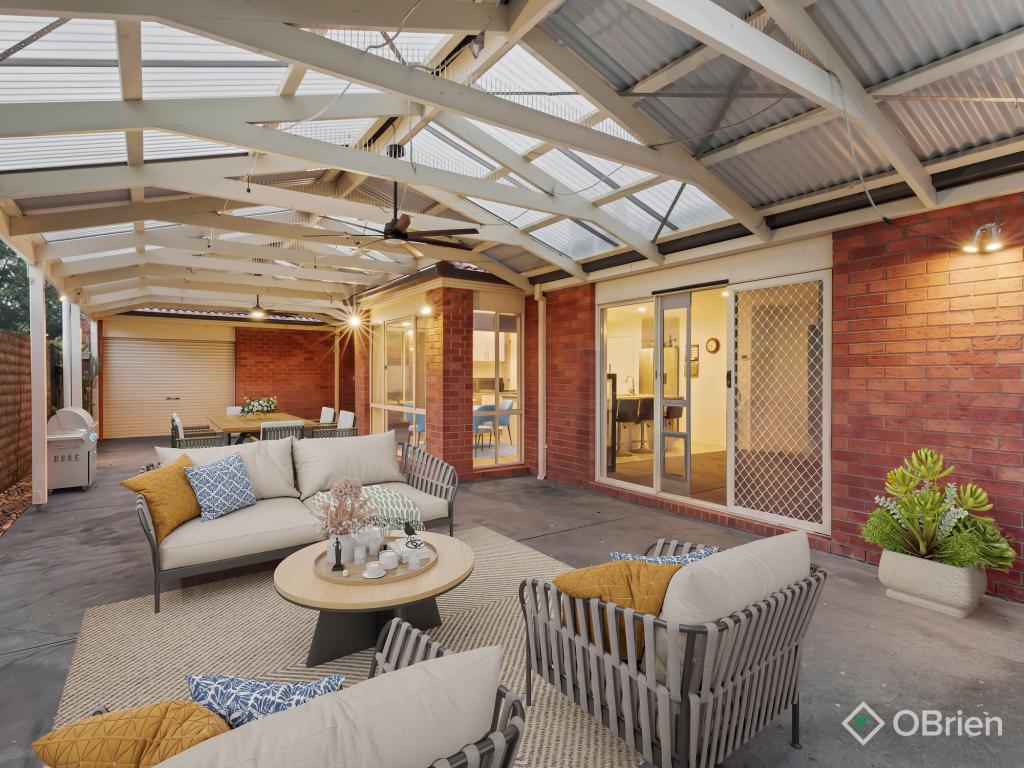 0
0
Similar properties For Rent nearby
See more properties for rent nearby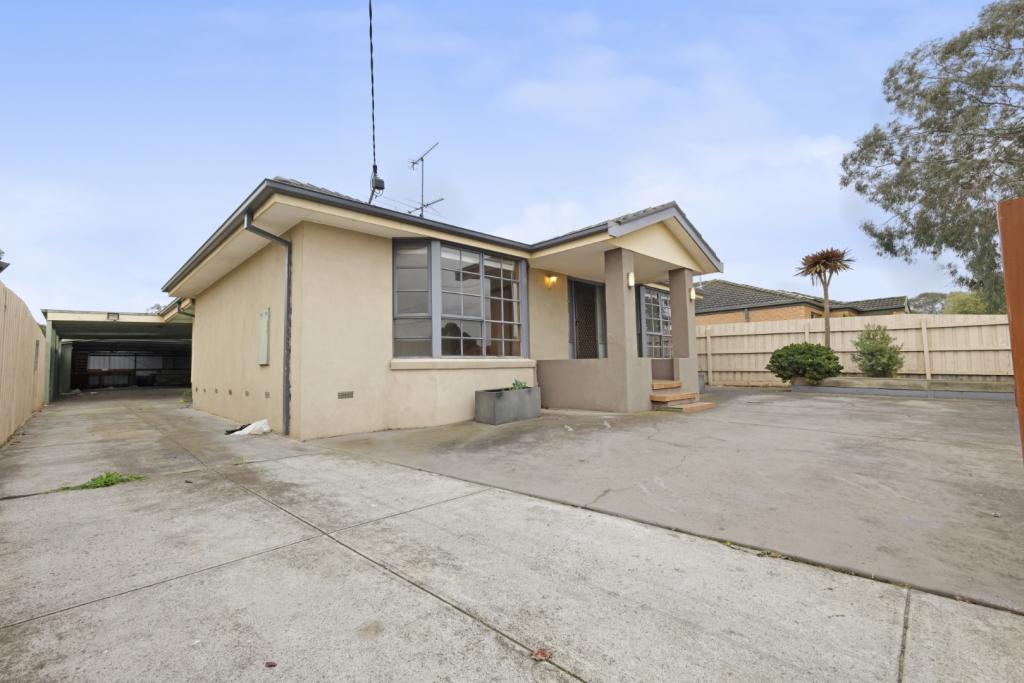 0
0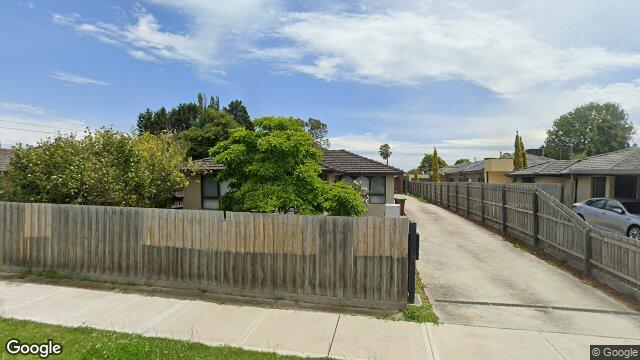 0
0About Cranbourne 3977
The size of Cranbourne is approximately 16.5 square kilometres. There are 47 parks, covering nearly 40.2% of the total area. The population of Cranbourne in 2016 was 20094 people. By 2021 the population was 21281 showing a population growth of 5.9% in the area during that time. The predominant age group in Cranbourne is 30-39 years. Households in Cranbourne are primarily couples with children and are likely to be repaying $1800 - $2399 per month on mortgage repayments. In general, people in Cranbourne work in a trades occupation.In 2021, 63.50% of the homes in Cranbourne were owner-occupied compared with 66.20% in 2016.
Cranbourne has 10,924 properties. Over the last 5 years, Houses in Cranbourne have seen a 23.55% increase in median value, while Units have seen a 25.70% increase. As at 30 June 2026:
- The median value for Houses in Cranbourne is $770,782 while the median value for Units is $539,792.
- Houses have a median rent of $550 while Units have a median rent of $493.
Suburb Insights for Cranbourne 3977
Market Insights
Cranbourne Trends for Houses
N/A
N/A
View TrendN/A
N/A
Cranbourne Trends for Units
N/A
N/A
View TrendN/A
N/A
Neighbourhood Insights
© Copyright 2026. RP Data Pty Ltd trading as Cotality (Cotality). All rights reserved. No reproduction, distribution, or transmission of the copyrighted materials is permitted. The information is deemed reliable but not guaranteed.
While Cotality uses commercially reasonable efforts to ensure the Cotality Data is current, Cotality does not warrant the accuracy, currency or completeness of the Cotality Data and to the full extent permitted by law excludes all loss or damage howsoever arising (including through negligence) in connection with the Cotality Data.
This product uses cookies and other similar technologies to improve and customise your browsing experience, to tailor content and adverts, and for analytics and metrics regarding visitor usage on this product and other media. We may share cookie and analytics information with third parties for the purposes of advertising. By continuing to use our website, you consent to cookies being used. View our Privacy Policy here.
X