
216-230 Mount StreetUpper Burnie TAS 7320
Property Details for 216-230 Mount St, Upper Burnie
Last Listing description (March 2016)
RENEWED 20 YEAR LEASE TO 2031 PLUS OPTIONS TO 2051.BURNIE, A MAJOR COMMERCIAL CENTRE AND TASMANIA'S MAJOR PORT, HAS AN ESTIMATED CATCHMENT POPULATION IN EXCESS OF 50,000.FREESTANDING BUILDING OF 5,639 SQM, COMPRISING SUPERMARKET OF 3,989 SQM AND 1,650 SQM RESERVE AREA, PLUS A LARGE CAR PARK OF 195 ON TITLE SPACES, ALL FULLY LEASED TO WOOLWORTHS.PROMINENT ISLAND SITE OF 10,978 SQM WITH 4 STREET FRONTAGES.READILY ACCESSIBLE LOCATION STRATEGICALLY CENTRAL TO BURNIE'S RESIDENTIAL POPULATION.SINGLE TENANT EASILY MANAGED INVESTMENT PROPERTY.HUGE INCOME TAX SAVING DEPRECIATION BENEFITS.NET RENTAL: $1,236,483 PA PLUS GST.FOR SALE BY EXPRESSIONS OF INTEREST CLOSING 4PM AEDT WEDNESDAY 3 MARCH 2016
Property History for 216-230 Mount St, Upper Burnie, TAS 7320
- 08 Mar 2016Listed for Sale Not Disclosed
- 13 Sep 1994Sold for $1,800,000
- 16 Jun 1994Sold for $1,714,056
Recent sales nearby
See more recent sales nearbySimilar properties For Sale nearby
See more properties for sale nearby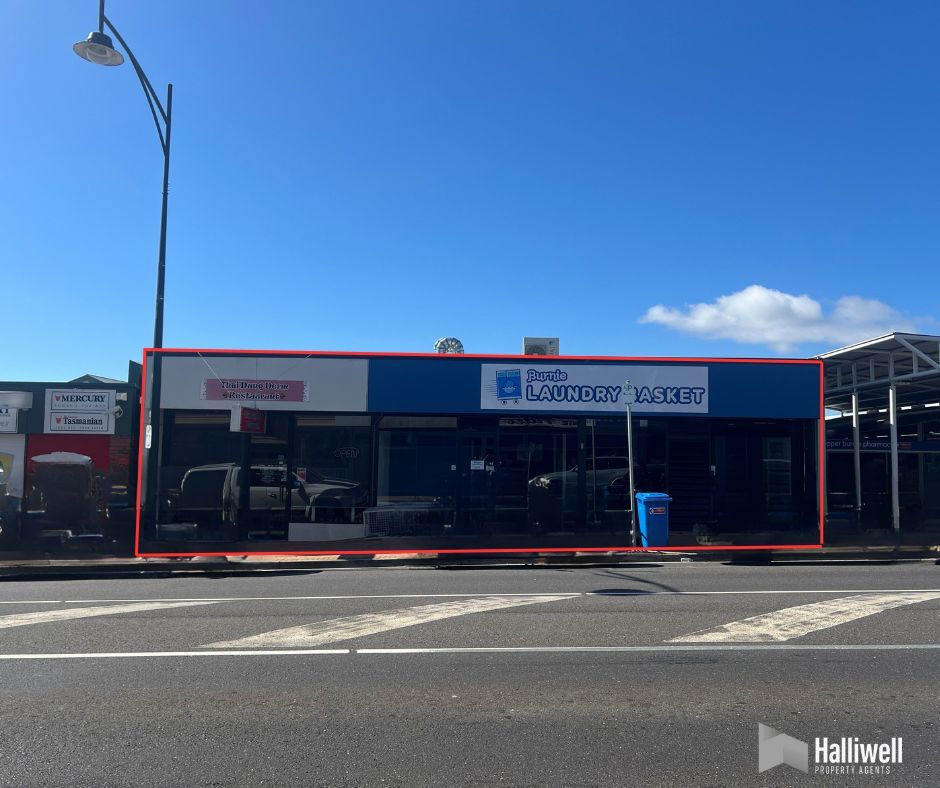 0
0 0
0 0
0Similar properties For Rent nearby
See more properties for rent nearby
 0
0 0
0 0
0About Upper Burnie 7320
The size of Upper Burnie is approximately 1.2 square kilometres. There is 1 park, covering nearly 6.9% of the total area. The population of Upper Burnie in 2016 was 1821 people. By 2021 the population was 1891 showing a population growth of 3.8% in the area during that time. The predominant age group in Upper Burnie is 60-69 years. Households in Upper Burnie are primarily childless couples and are likely to be repaying $1000 - $1399 per month on mortgage repayments. In general, people in Upper Burnie work in a trades occupation.In 2021, 57.40% of the homes in Upper Burnie were owner-occupied compared with 56.70% in 2016.
Upper Burnie has 982 properties. Over the last 5 years, Houses in Upper Burnie have seen a 75.20% increase in median value, while Units have seen a 66.30% increase. As at 31 May 2026:
- The median value for Houses in Upper Burnie is $493,730 while the median value for Units is $413,547.
- Houses have a median rent of $450 while Units have a median rent of $350.
Suburb Insights for Upper Burnie 7320
Market Insights
Upper Burnie Trends for Houses
N/A
N/A
View TrendN/A
N/A
Upper Burnie Trends for Units
N/A
N/A
View TrendN/A
N/A
Neighbourhood Insights
© Copyright 2026. RP Data Pty Ltd trading as Cotality (Cotality). All rights reserved. No reproduction, distribution, or transmission of the copyrighted materials is permitted. The information is deemed reliable but not guaranteed.
While Cotality uses commercially reasonable efforts to ensure the Cotality Data is current, Cotality does not warrant the accuracy, currency or completeness of the Cotality Data and to the full extent permitted by law excludes all loss or damage howsoever arising (including through negligence) in connection with the Cotality Data.
This product uses cookies and other similar technologies to improve and customise your browsing experience, to tailor content and adverts, and for analytics and metrics regarding visitor usage on this product and other media. We may share cookie and analytics information with third parties for the purposes of advertising. By continuing to use our website, you consent to cookies being used. View our Privacy Policy here.
X