
11 Deacon StreetUpper Burnie TAS 7320
Property Details for 11 Deacon St, Upper Burnie
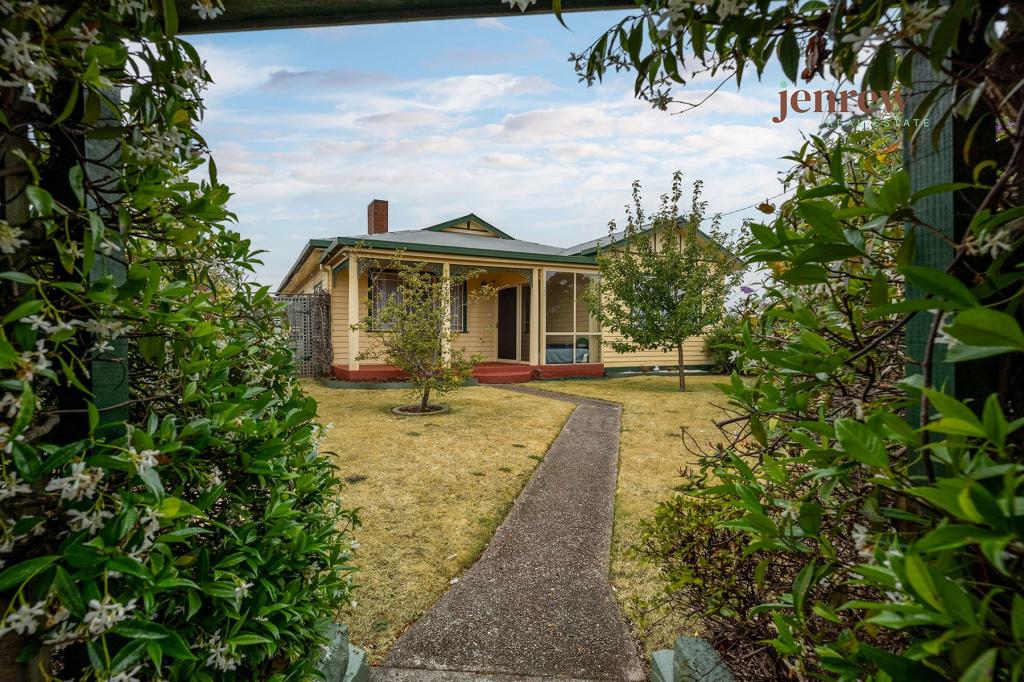
11 Deacon St, Upper Burnie is a 4 bedroom, 2 bathroom House with 1 parking spaces and was built in 1935. The property has a land size of 663m2 and floor size of 137m2. While the property is not currently for sale or for rent, it was last sold in August 2024.
Last Listing description (June 2026)
Driving you to your new home destination!
A 1935 built charmer and magnetic stand-out property on this conveniently located Upper Burnie strip.
About the property:
- Wood heater
- Multi zoned ducted heating
- Updated kitchen with dishwasher
- Induction cooktop
- Bi-fold doors to undercover patio
- Solar panels
- Single carport
Lease Details:
- 12 month lease
- Sorry this property is not suitable for pets
- Available 22nd November 2024
Inspecting:
All applications must be submitted to our agency. Pre-approved applicants will be contacted to arrange a private inspection.
How to Apply:
To apply please use the link below to be directed to Tenant Options.
https://tenantoptions.com.au
DISCLAIMER: All information above has been provided to us by the owner/s and other third-party providers. We cannot guarantee the accuracy of the information and Jenrew Real Estate makes no statement, representation, or warranty, and assumes no legal liability in relation to the accuracy of the information provided. Interested parties should conduct their own inquiries in relation to the property they are considering leasing to determine whether this information is in fact accurate.
Property History for 11 Deacon St, Upper Burnie, TAS 7320
- 14 Nov 2024Listed for Rent $450 / week
- 28 Aug 2024Sold for $569,000
- 20 Aug 2024Listed for Sale $569,000

Recent sales nearby
See more recent sales nearbySimilar properties For Sale nearby
See more properties for sale nearby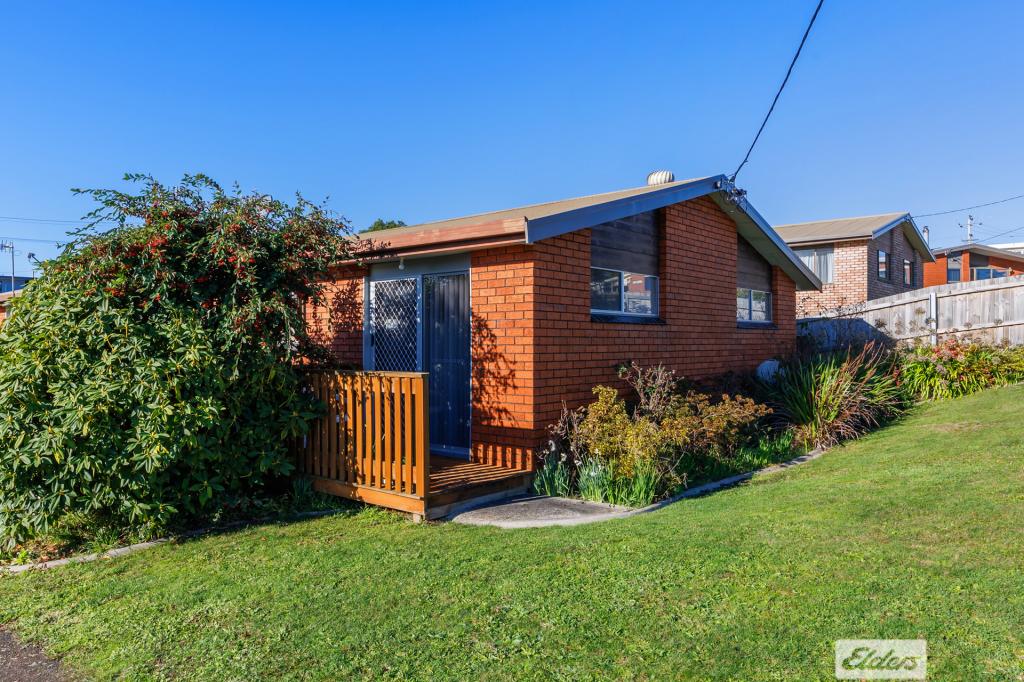 0
0 0
0 0
0Similar properties For Rent nearby
See more properties for rent nearby
 0
0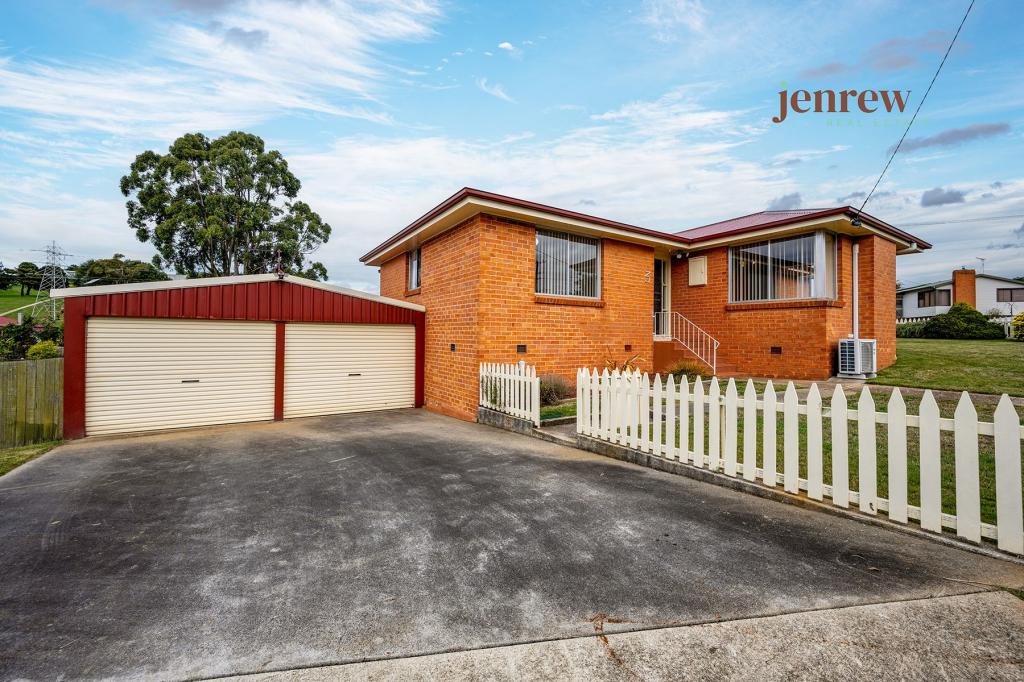 0
0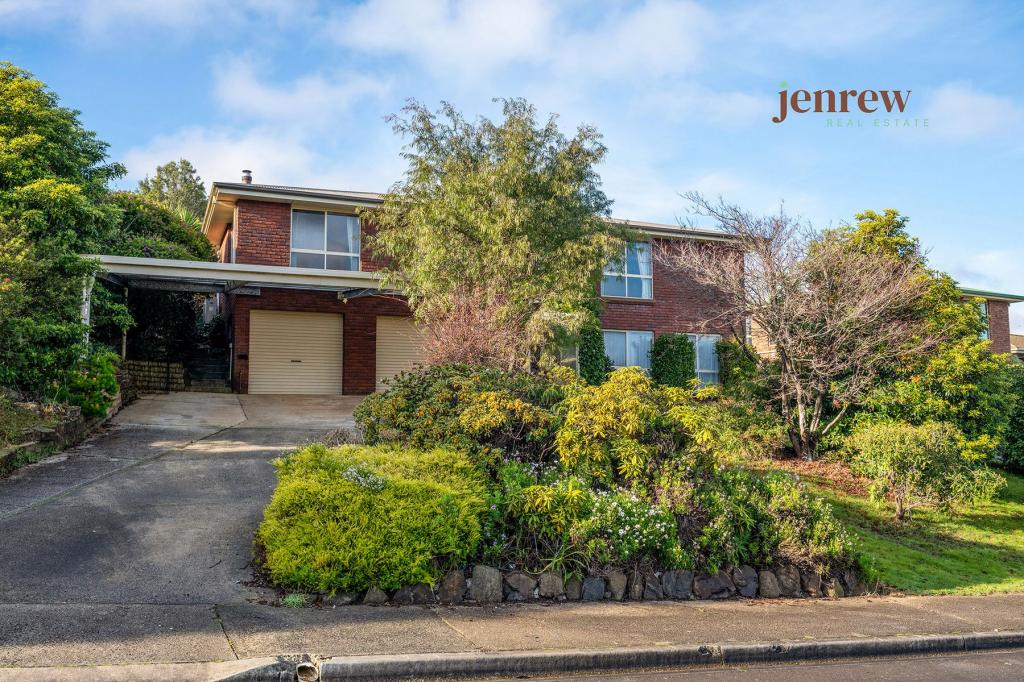 0
0About Upper Burnie 7320
The size of Upper Burnie is approximately 1.2 square kilometres. There is 1 park, covering nearly 6.9% of the total area. The population of Upper Burnie in 2016 was 1821 people. By 2021 the population was 1891 showing a population growth of 3.8% in the area during that time. The predominant age group in Upper Burnie is 60-69 years. Households in Upper Burnie are primarily childless couples and are likely to be repaying $1000 - $1399 per month on mortgage repayments. In general, people in Upper Burnie work in a trades occupation.In 2021, 57.40% of the homes in Upper Burnie were owner-occupied compared with 56.70% in 2016.
Upper Burnie has 985 properties. Over the last 5 years, Houses in Upper Burnie have seen a 74.87% increase in median value, while Units have seen a 78.21% increase. As at 30 June 2026:
- The median value for Houses in Upper Burnie is $503,763 while the median value for Units is $444,794.
- Houses have a median rent of $450 while Units have a median rent of $360.
Suburb Insights for Upper Burnie 7320
Market Insights
Upper Burnie Trends for Houses
N/A
N/A
View TrendN/A
N/A
Upper Burnie Trends for Units
N/A
N/A
View TrendN/A
N/A
Neighbourhood Insights
© Copyright 2026. RP Data Pty Ltd trading as Cotality (Cotality). All rights reserved. No reproduction, distribution, or transmission of the copyrighted materials is permitted. The information is deemed reliable but not guaranteed.
While Cotality uses commercially reasonable efforts to ensure the Cotality Data is current, Cotality does not warrant the accuracy, currency or completeness of the Cotality Data and to the full extent permitted by law excludes all loss or damage howsoever arising (including through negligence) in connection with the Cotality Data.
This product uses cookies and other similar technologies to improve and customise your browsing experience, to tailor content and adverts, and for analytics and metrics regarding visitor usage on this product and other media. We may share cookie and analytics information with third parties for the purposes of advertising. By continuing to use our website, you consent to cookies being used. View our Privacy Policy here.
X