
9 Hopkinson StreetSouth Burnie TAS 7320
Property Details for 9 Hopkinson St, South Burnie
9 Hopkinson St, South Burnie is a 2 bedroom, 1 bathroom Car Space with 1 parking spaces and was built in 2018. The property has a land size of 278m2 and floor size of 96m2. While the property is not currently for sale or for rent, it was last sold in July 2025. There are other 2 bedroom Car Space sold in South Burnie in the last 12 months.
Last Listing description (November 2013)
Investment or Home Minutes to Town
What will you use this great property for...... Investment, home or office space?
This property is quite a lot bigger than you would think.
With a new Rinnai Gas hot water system installed all you need to decide is what you want to use this property for.
Call us 7 days a week.
Property History for 9 Hopkinson St, South Burnie, TAS 7320
- 16 Jul 2025Sold for $80,000
- 14 Mar 2017Sold for $500,000
- 13 Feb 2015Sold for $80,000
Similar properties For Sale nearby
See more properties for sale nearby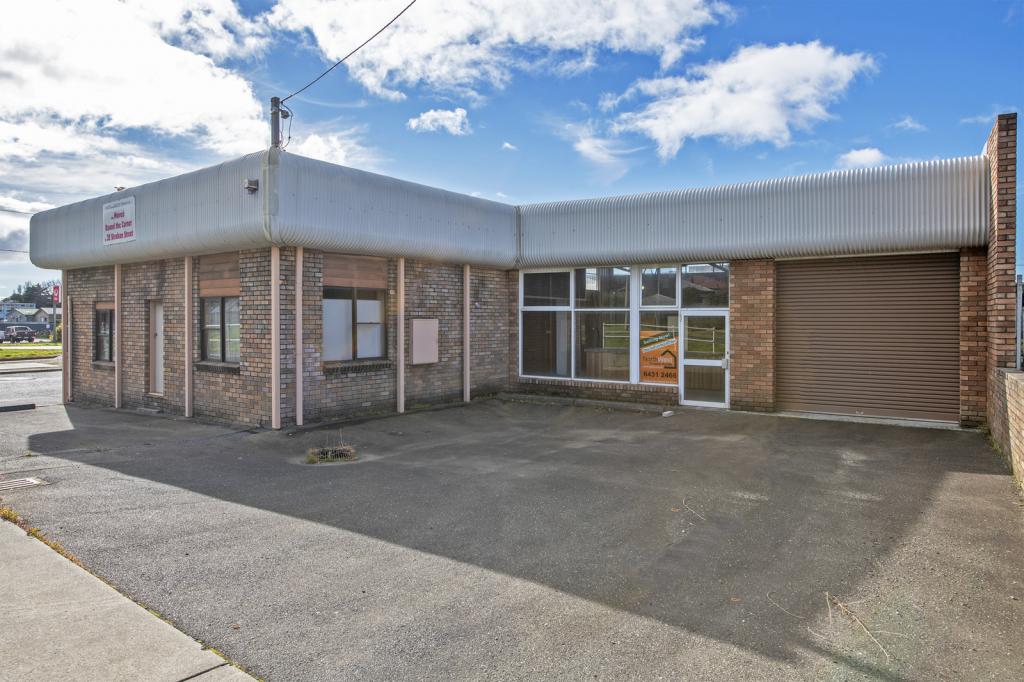 0
0 0
0 0
0Similar properties For Rent nearby
See more properties for rent nearby
 0
0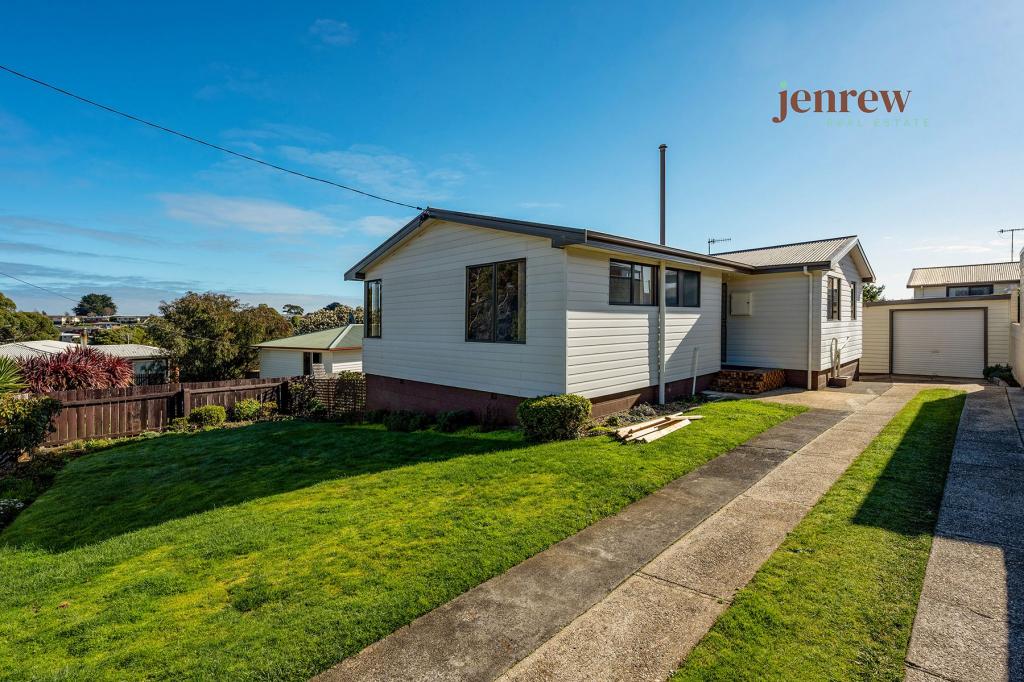 0
0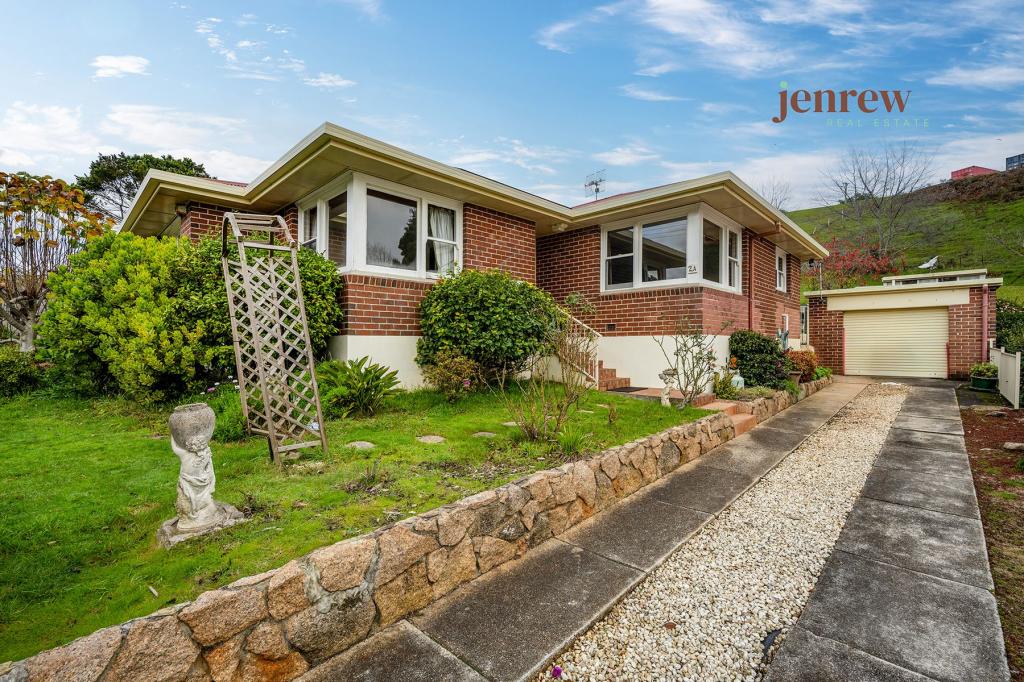 0
0About South Burnie 7320
The size of South Burnie is approximately 1.7 square kilometres. There are 4 parks, covering nearly 4.5% of the total area. The population of South Burnie in 2016 was 331 people. By 2021 the population was 348 showing a population growth of 5.1% in the area during that time. The predominant age group in South Burnie is 30-39 years. Households in South Burnie are primarily childless couples and are likely to be repaying $1000 - $1399 per month on mortgage repayments. In general, people in South Burnie work in a community and personal service occupation.In 2021, 69.20% of the homes in South Burnie were owner-occupied compared with 68.10% in 2016.
South Burnie has 334 properties. Over the last 5 years, Houses in South Burnie have seen a 70.66% increase in median value, while Units have seen a 65.14% increase. As at 30 June 2026:
- The median value for Houses in South Burnie is $500,562 while the median value for Units is $446,664.
- Houses have a median rent of $410.
Suburb Insights for South Burnie 7320
Market Insights
South Burnie Trends for Houses
N/A
N/A
View TrendN/A
N/A
South Burnie Trends for Units
N/A
N/A
View TrendN/A
N/A
Neighbourhood Insights
© Copyright 2026. RP Data Pty Ltd trading as Cotality (Cotality). All rights reserved. No reproduction, distribution, or transmission of the copyrighted materials is permitted. The information is deemed reliable but not guaranteed.
While Cotality uses commercially reasonable efforts to ensure the Cotality Data is current, Cotality does not warrant the accuracy, currency or completeness of the Cotality Data and to the full extent permitted by law excludes all loss or damage howsoever arising (including through negligence) in connection with the Cotality Data.
This product uses cookies and other similar technologies to improve and customise your browsing experience, to tailor content and adverts, and for analytics and metrics regarding visitor usage on this product and other media. We may share cookie and analytics information with third parties for the purposes of advertising. By continuing to use our website, you consent to cookies being used. View our Privacy Policy here.
X