
35 Studholme StreetSouth Burnie TAS 7320
Property Details for 35 Studholme St, South Burnie
35 Studholme St, South Burnie is a 3 bedroom, 1 bathroom House with 1 parking spaces and was built in 1948. The property has a land size of 663m2 and floor size of 129m2. While the property is not currently for sale or for rent, it was last sold in December 2018.
Last Listing description (March 2026)
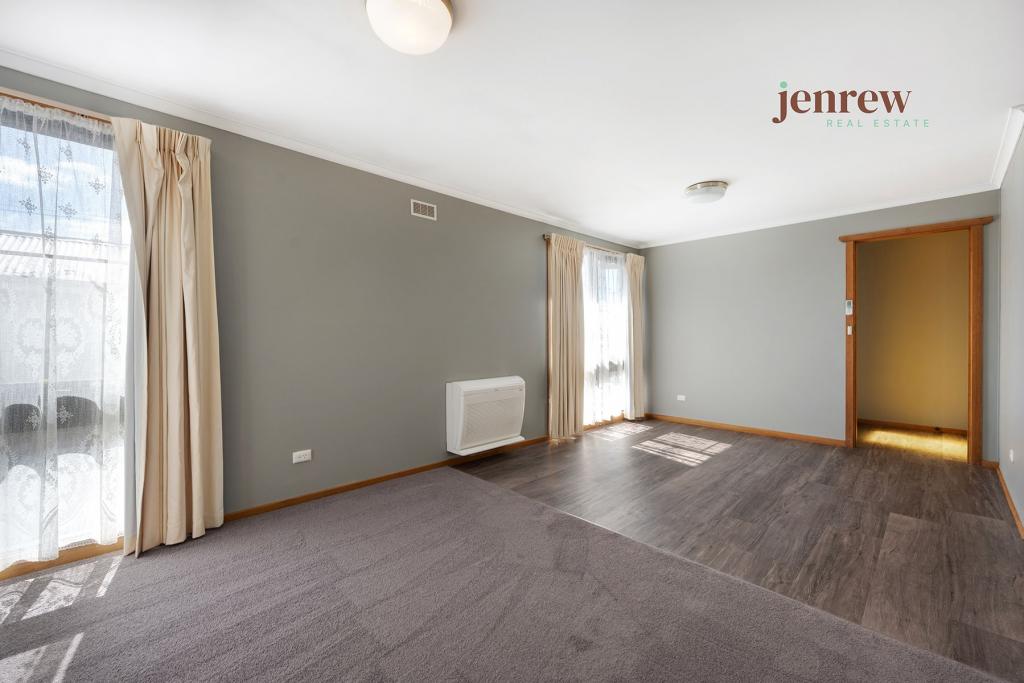
Positioned in a convenient pocket of South Burnie, this well-presented home offers comfortable living with space, practicality and easy access to local amenities. Perfect for families, couples or professionals, the property provides a welcoming environment in a quiet residential street just minutes from Burnie's CBD, beaches and local schools.
Property Features:
Three well-sized bedrooms
Light-filled living area for comfortable everyday living
Functional kitchen with ample storage
Spacious yard with room to enjoy the outdoors
Lease Details
- 12 months preferred
- Available 30th March 2026
- At any stage before or throughout this tenancy, the tenant will be required to obtain the owner's consent using the approved form to keep a pet at the premises.
Once your application and supporting documents have been received we will be in touch as your application progresses through the system and to arrange an inspection.
Property History for 35 Studholme St, South Burnie, TAS 7320
- 06 Mar 2026Listed for Rent $335 / week
- 25 May 2022Listed for Rent $300 / week
- 20 Mar 2019Listed for Rent - Price not available

Recent sales nearby
See more recent sales nearbySimilar properties For Sale nearby
See more properties for sale nearby 0
0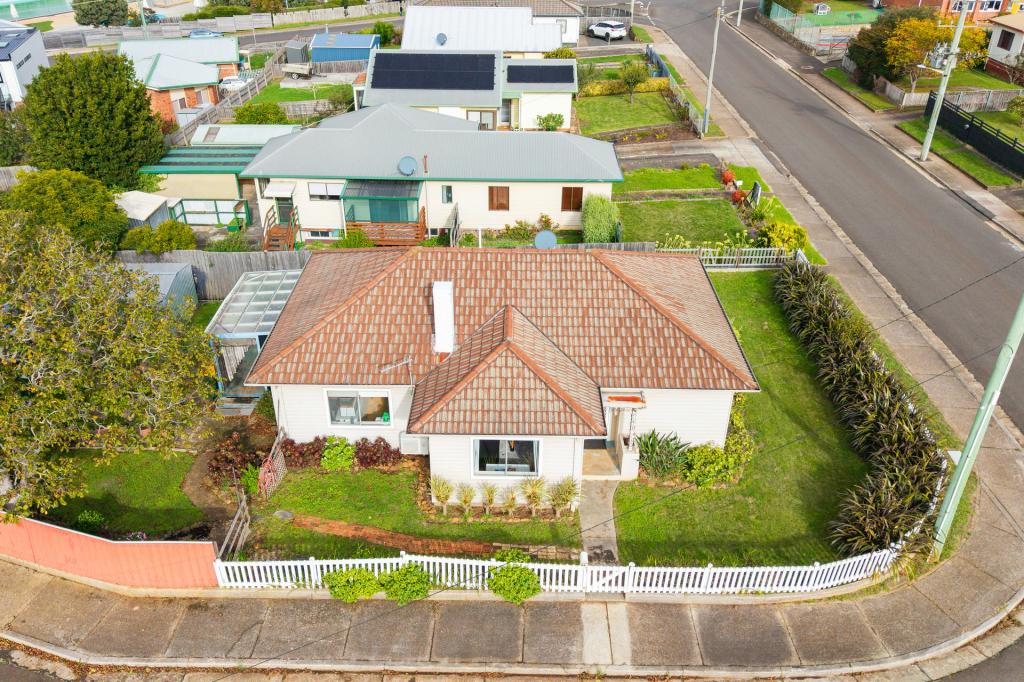 0
0 0
0Similar properties For Rent nearby
See more properties for rent nearby 0
0
 0
0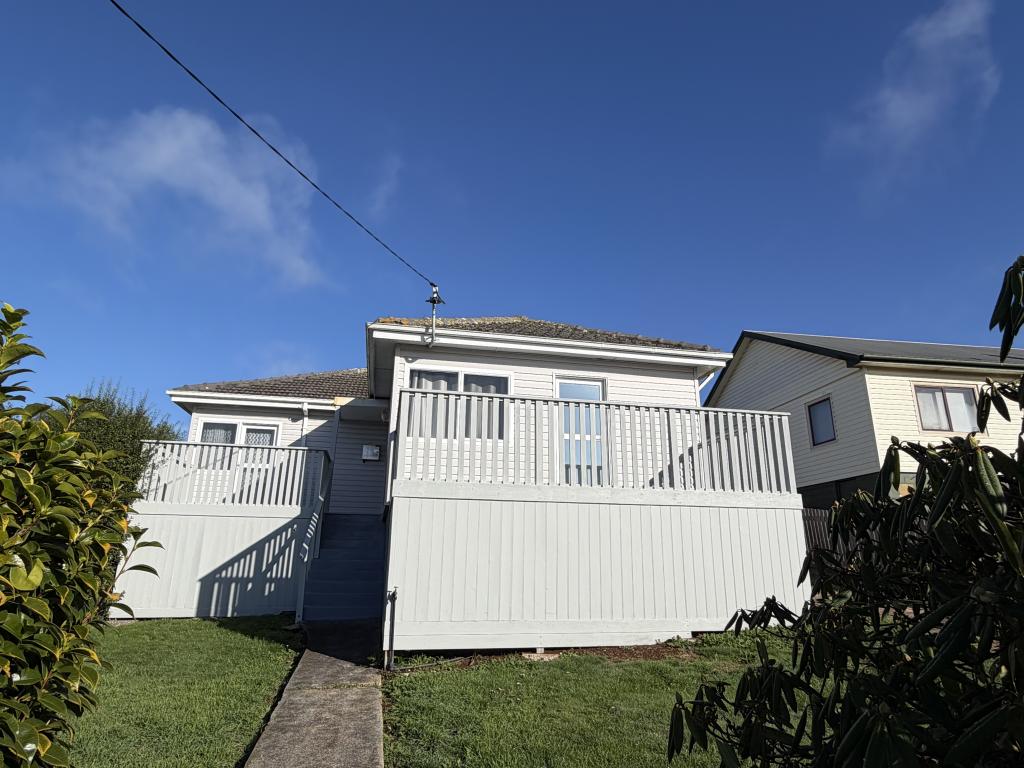 0
0About South Burnie 7320
The size of South Burnie is approximately 1.7 square kilometres. There are 4 parks, covering nearly 4.5% of the total area. The population of South Burnie in 2016 was 331 people. By 2021 the population was 348 showing a population growth of 5.1% in the area during that time. The predominant age group in South Burnie is 30-39 years. Households in South Burnie are primarily childless couples and are likely to be repaying $1000 - $1399 per month on mortgage repayments. In general, people in South Burnie work in a community and personal service occupation.In 2021, 69.20% of the homes in South Burnie were owner-occupied compared with 68.10% in 2016.
South Burnie has 334 properties. Over the last 5 years, Houses in South Burnie have seen a 77.55% increase in median value, while Units have seen a 72.32% increase. As at 30 April 2026:
- The median value for Houses in South Burnie is $487,185 while the median value for Units is $462,720.
- Houses have a median rent of $420.
Suburb Insights for South Burnie 7320
Market Insights
South Burnie Trends for Houses
N/A
N/A
View TrendN/A
N/A
South Burnie Trends for Units
N/A
N/A
View TrendN/A
N/A
Neighbourhood Insights
© Copyright 2026. RP Data Pty Ltd trading as Cotality (Cotality). All rights reserved. No reproduction, distribution, or transmission of the copyrighted materials is permitted. The information is deemed reliable but not guaranteed.
While Cotality uses commercially reasonable efforts to ensure the Cotality Data is current, Cotality does not warrant the accuracy, currency or completeness of the Cotality Data and to the full extent permitted by law excludes all loss or damage howsoever arising (including through negligence) in connection with the Cotality Data.
This product uses cookies and other similar technologies to improve and customise your browsing experience, to tailor content and adverts, and for analytics and metrics regarding visitor usage on this product and other media. We may share cookie and analytics information with third parties for the purposes of advertising. By continuing to use our website, you consent to cookies being used. View our Privacy Policy here.
X