
44 East GlenPort Sorell TAS 7307

Thinking about insurance?
Get estimated rebuild costs for this property with Sum SureProperty Details for 44 East Glen, Port Sorell
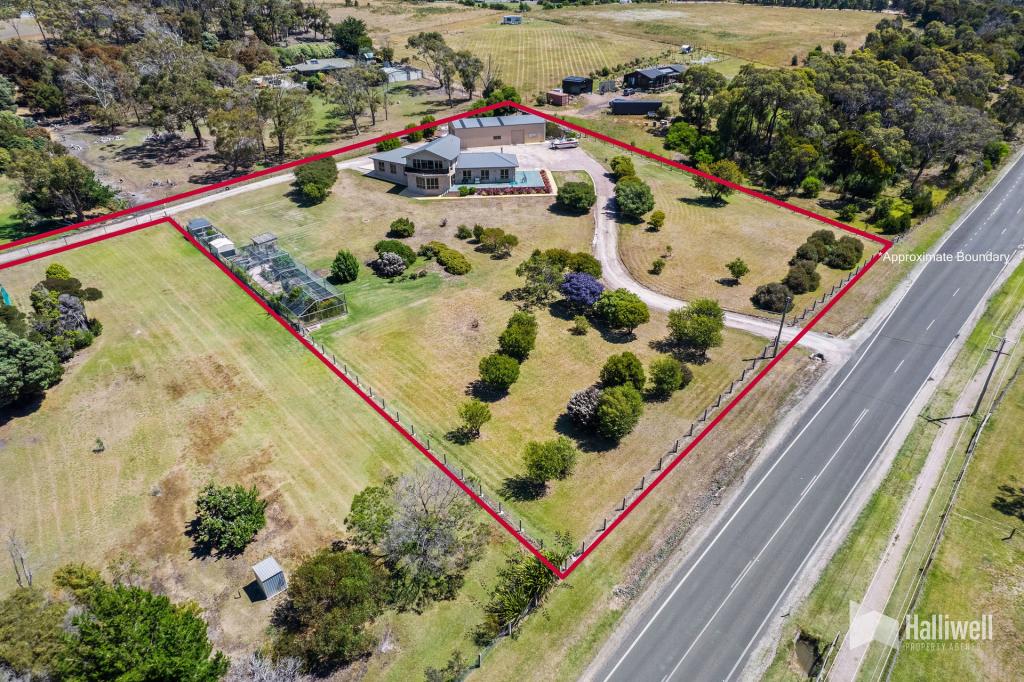
44 East Glen, Port Sorell is a 3 bedroom, 2 bathroom House and was built in 1988. The property has a land size of 20030m2 and floor size of 212m2. While the property is not currently for sale or for rent, it was last sold in October 1991.
Last Listing description (November 2016)
Large three bedroom home with ensuite to main, all three have built ins. Large living room with wood heater and family room with bar. Fenced house garden and set in a large allotment ideal for horses etc.
Property History for 44 East Glen, Port Sorell, TAS 7307
- 30 Sep 2016Listed for Rent - Price not available
- 24 Sep 2014Listed for Rent - Price not available
- 16 Dec 2009Listed for Rent - Price not available

Recent sales nearby
See more recent sales nearbySimilar properties For Sale nearby
See more properties for sale nearby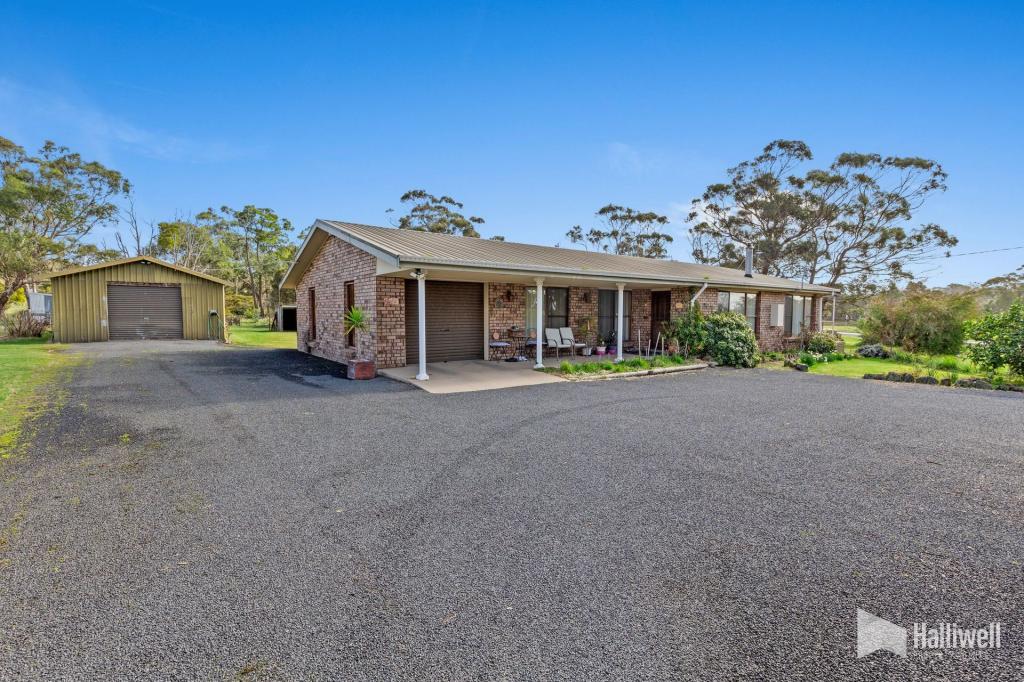
About Port Sorell 7307
The size of Port Sorell is approximately 9.8 square kilometres. It has 8 parks covering nearly 5.9% of total area. The population of Port Sorell in 2016 was 2022 people. By 2021 the population was 2221 showing a population growth of 9.8% in the area during that time. The predominant age group in Port Sorell is 60-69 years. Households in Port Sorell are primarily childless couples and are likely to be repaying $1000 - $1399 per month on mortgage repayments. In general, people in Port Sorell work in a trades occupation.In 2021, 77.80% of the homes in Port Sorell were owner-occupied compared with 74.60% in 2016..
Port Sorell has 1,316 properties. Over the last 5 years, Houses in Port Sorell have seen a 75.72% increase in median value, while Units have seen a 59.77% increase. As at 31 July 2025:
- The median value for Houses in Port Sorell is $705,654 while the median value for Units is $447,184.
- Houses have a median rent of $490 while Units have a median rent of $370.
What's around 44 East Glen, Port Sorell


Suburb Insights for Port Sorell 7307
Market Insights
Port Sorell Trends for Houses
$706k
4.09%
View Trend$490/W
4.11%
Port Sorell Trends for Units
$447k
5.12%
View Trend$370/W
4.55%
Neighbourhood Insights
Age
Population 2,221
0-9
10%
10-19
9%
20-29
7%
30-39
10%
40-49
10%
50-59
17%
60-69
18%
70-79
14%
80-89
4%
Household Structure
Occupancy
© Copyright 2025. RP Data Pty Ltd trading as Cotality (Cotality). All rights reserved. No reproduction, distribution, or transmission of the copyrighted materials is permitted. The information is deemed reliable but not guaranteed.
While Cotality uses commercially reasonable efforts to ensure the Cotality Data is current, Cotality does not warrant the accuracy, currency or completeness of the Cotality Data and to the full extent permitted by law excludes all loss or damage howsoever arising (including through negligence) in connection with the Cotality Data.
(a) give no warranty regarding the data's accuracy, completeness, currency or suitability for any particular purpose; and
(b) do not accept liability howsoever arising, including but not limited to negligence for any loss resulting from the use of or reliance upon the data.
Base data from the LIST © State of Tasmania http://www.thelist.tas.gov.au.
This publication contains data and statistics provided by the Australian Bureau of Statistics (ABS Data). ©2025 Copyright in this information belongs to the Australian Bureau of Statistics (ABS). The ABS provides no warranty that the ABS Data is free from error, complete or suitable for any particular purpose.
This product uses cookies and other similar technologies to improve and customise your browsing experience, to tailor content and adverts, and for analytics and metrics regarding visitor usage on this product and other media. We may share cookie and analytics information with third parties for the purposes of advertising. By continuing to use our website, you consent to cookies being used. View our Privacy Policy here.
X