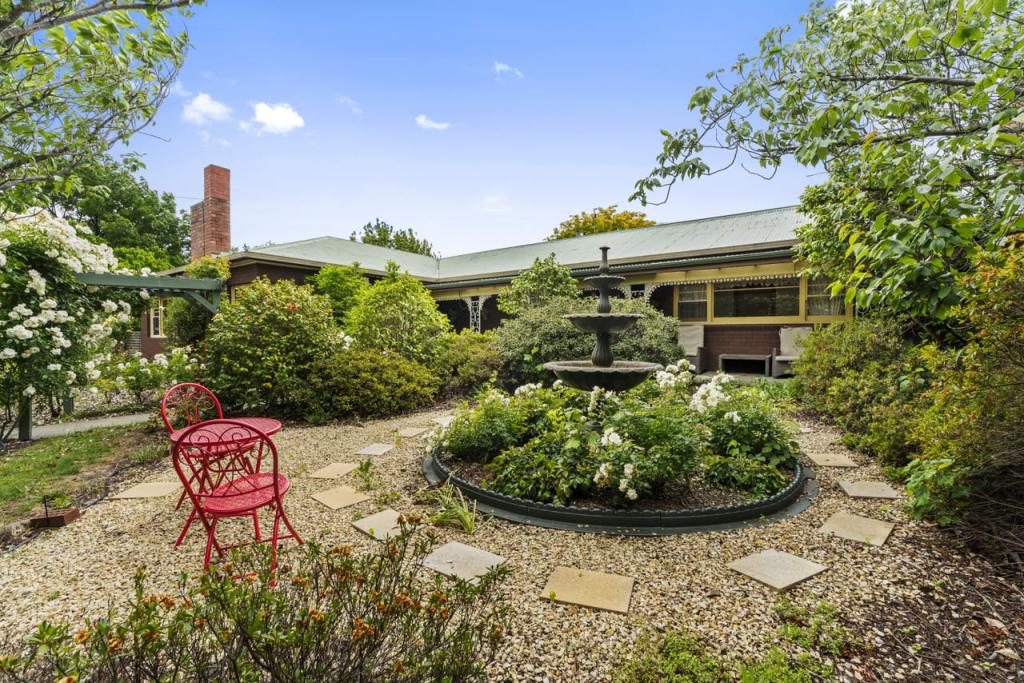
2 Jingella CircleNew Norfolk TAS 7140

Thinking about insurance?
Get estimated rebuild costs for this property with Sum SureProperty Details for 2 Jingella Cir, New Norfolk
2 Jingella Cir, New Norfolk is a bedroom, bathroom House and was built in 1966. The property has a land size of 1058m2 and floor size of 97m2. While the property is not currently for sale or for rent, it was last sold in September 1994.
Property History for 2 Jingella Cir, New Norfolk, TAS 7140
- 02 Sep 1994Sold for $59,500
- 14 Feb 1992Sold for $8,320
Recent sales nearby
See more recent sales nearbySimilar properties For Sale nearby
See more properties for sale nearby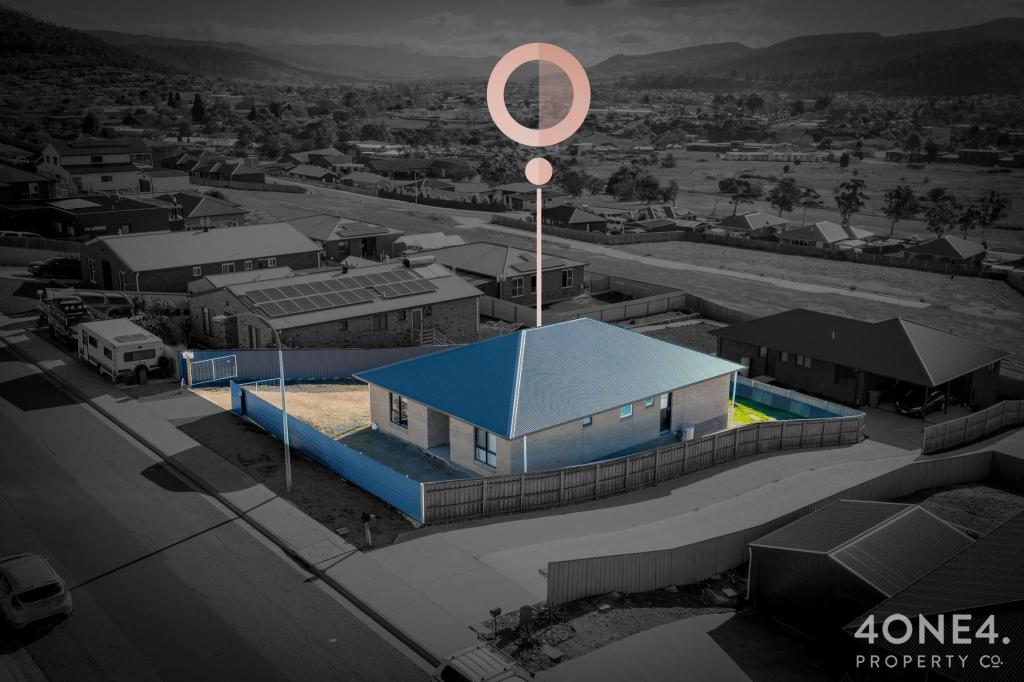


Similar properties For Rent nearby
See more properties for rent nearby
About New Norfolk 7140
The size of New Norfolk is approximately 18.5 square kilometres. It has 20 parks covering nearly 9.6% of total area. The population of New Norfolk in 2016 was 5432 people. By 2021 the population was 6037 showing a population growth of 11.1% in the area during that time. The predominant age group in New Norfolk is 30-39 years. Households in New Norfolk are primarily childless couples and are likely to be repaying $1000 - $1399 per month on mortgage repayments. In general, people in New Norfolk work in a trades occupation.In 2021, 66.10% of the homes in New Norfolk were owner-occupied compared with 62.90% in 2016..
New Norfolk has 3,133 properties. Over the last 5 years, Houses in New Norfolk have seen a 47.33% increase in median value, while Units have seen a 56.48% increase. As at 30 June 2025:
- The median value for Houses in New Norfolk is $460,883 while the median value for Units is $441,423.
- Houses have a median rent of $450 while Units have a median rent of $420.
What's around 2 Jingella Cir, New Norfolk
2 Jingella Cir, New Norfolk is in the school catchment zone for Fairview Primary School.


Suburb Insights for New Norfolk 7140
Market Insights
New Norfolk Trends for Houses
$461k
-1.11%
View Trend$450/W
5.40%
New Norfolk Trends for Units
$441k
-0.14%
View Trend$420/W
5.21%
Neighbourhood Insights
Age
Population 6,037
0-9
12%
10-19
13%
20-29
12%
30-39
14%
40-49
11%
50-59
13%
60-69
13%
70-79
9%
80-89
5%
90-99
1%
Household Structure
Occupancy
© Copyright 2025 RP Data Pty Ltd trading as CoreLogic Asia Pacific (CoreLogic). All rights reserved.
(a) give no warranty regarding the data's accuracy, completeness, currency or suitability for any particular purpose; and
(b) do not accept liability howsoever arising, including but not limited to negligence for any loss resulting from the use of or reliance upon the data.
Base data from the LIST © State of Tasmania http://www.thelist.tas.gov.au.
This product uses cookies and other similar technologies to improve and customise your browsing experience, to tailor content and adverts, and for analytics and metrics regarding visitor usage on this product and other media. We may share cookie and analytics information with third parties for the purposes of advertising. By continuing to use our website, you consent to cookies being used. View our Privacy Policy here.
X