2 Main Street, Kempton, TAS 7030 | Property Value & History | OnTheHouse
OFF MARKET
Are you the owner?

2 Main Street
Kempton TAS 7030

Bedrooms: 4
Bathrooms: 2
Car spaces: 2
Floor area: 191m2
Land area: 9204m2
Estimated Value & Rent
Estimated Value
Estimated Rent
Medium-Low Confidence
Last updated 12 May 2025
Low

High
$650k
$700k
Save

Property Details for 2 Main St, Kempton

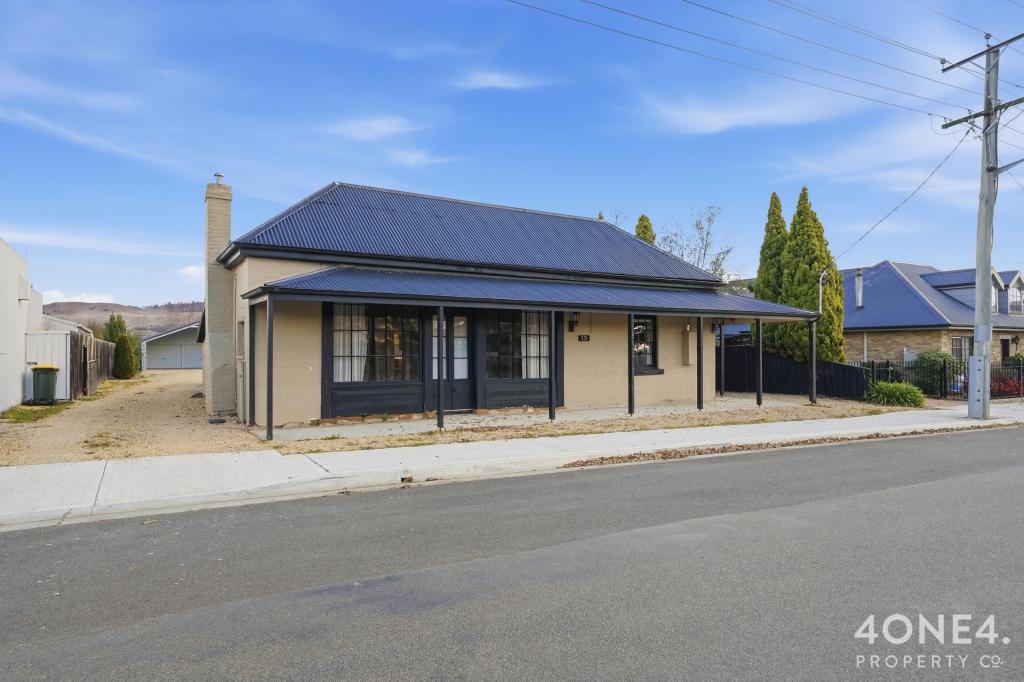
2 Main St, Kempton is a 4 bedroom, 2 bathroom House with 2 parking spaces and was built in 1979. The property has a land size of 9204m2 and floor size of 191m2. While the property is not currently for sale or for rent, it was last sold in June 2009.

Building Type
House
Year Built
1979
Floor Size
191m2
Land Size
9204m2
Local Government
Southern Midlands
Lot/Plan
1/149423

Last Listing description (August 2009)

Spacious Living
Set in a quiet historic town on 9200m2 (2.27 acres) is this family home. Consisting of four bedrooms with built in robes, open plan kitchen/family and two other living areas, wood heating, freshly painted, double carport, workshop and two patio areas to soak up the sun and take in the pleasant surroundings. The large land size has possible subdivision potential (STCA) and the property is on town services. Well worth inspecting.
Additional feature - Built-In Wardrobes.

Property History for 2 Main St, Kempton, TAS 7030

A timeline of how this property has performed in the market
Last Sold
$320,000
28 Jun 2009
  • 28 Jun 2009
    Sold for $320,000
  • 11 Apr 2009
    Listed for Sale $330,000
  • 13 Feb 2009
    Listed for Sale $330,000
Sign in to see more transactions

Commute Calculator

Where to?
-
-
-
-

About Kempton 7030

The size of Kempton is approximately 83.7 square kilometres. It has 2 parks. The population of Kempton in 2011 was 352 people. By 2016 the population was 381 showing a population growth of 8.2% in the area during that time. The predominant age group in Kempton is 60-69 years. Households in Kempton are primarily childless couples and are likely to be repaying $1400 - $1799 per month on mortgage repayments. In general, people in Kempton work in a clerical occupation. In 2011, 80.3% of the homes in Kempton were owner-occupied compared with 77.7% in 2016.

Kempton has 257 properties. Over the last 5 years, Houses in Kempton have seen a 83.56% increase in median value, while Units have seen a 53.07% increase. As at 30 April 2025:

  • The median value for Houses in Kempton is $476,373 while the median value for Units is $585,138.
There are currently 12 properties listed for sale, and no properties listed for rent in Kempton on OnTheHouse. According to CoreLogic's data, 15 properties were sold in the past 12 months in Kempton.

What's around 2 Main St, Kempton

2 Main St, Kempton is in the school catchment zone for Kempton Primary School.

Nearby Schools
Comparable Properties
Kempton Primary School
1.1km
Kempton 7030
IN CATCHMENTPrimaryGovernmentP - 6Combined29 Enrolled
Bagdad Primary School
9.78km
Bagdad 7030
PrimaryGovernmentP - 6Combined158 Enrolled
Brighton Primary School
18.64km
Brighton 7030
PrimaryGovernmentP - 6Combined608 Enrolled
Northern Christian School
21.78km
Bridgewater 7030
PrimaryNon-GovernmentP - 6Combined128 Enrolled
JRLF - Senior School
22.68km
Bridgewater 7030
SecondaryGovernment7 - 12Combined305 Enrolled
St Paul's Catholic School
22.77km
Bridgewater 7030
PrimaryNon-GovernmentP - 6Combined175 Enrolled
Campania District School
23.37km
Campania 7026
CombinedGovernmentP - 11Combined182 Enrolled
JRLF - East Derwent Primary School
23.49km
Bridgewater 7030
PrimaryGovernmentP - 6Combined349 Enrolled
Bothwell District High School
24.02km
Bothwell 7030
CombinedGovernmentP - 10Combined65 Enrolled
JRLF - Herdsmans Cove Primary School
24.3km
Herdsmans Cove 7030
PrimaryGovernmentP - 6Combined167 Enrolled

Suburb Insights for Kempton 7030

Market Insights
Kempton Trends for Houses
Median Value

$476k

6.49%
View Trend
Median Growth

6.01%

View Trend
Median Rent

N/A

-
View Trend
Rental Yield

5.54%

5.12%
View Trend
Median Value: The middle value of all properties across the geography based on the Automated Valuation Model.


Median Value over 1 year (05/24 - 04/25)
Kempton Trends for Units
Median Value

$585k

52.85%
View Trend
Median Growth

40.22%

View Trend
Median Rent

N/A

-
View Trend
Rental Yield

2.70%

38.50%
View Trend
Median Value: The middle value of all properties across the geography based on the Automated Valuation Model.


Median Value over 1 year (05/24 - 04/25)
Neighbourhood Insights
Age

Population 381

0-9


8%

10-19


16%

20-29


11%

30-39


10%

40-49


9%

50-59


16%

60-69


19%

70-79


7%

80-89


3%

Household Structure
Occupancy
Disclaimer
Whilst all reasonable effort is made to ensure the information in this publication is current, CoreLogic does not warrant the accuracy or completeness of the data and information contained in this publication and to the full extent not prohibited by law excludes all liability for any loss or damage arising in connection with the data and information contained in this publication.
Tasmania data
This product incorporates data that is copyright owned by the Crown in Right of Tasmania. The data has been used in the product with the permission of the Crown in Right of Tasmania. The Crown in Right of Tasmania and its employees and agents:

(a) give no warranty regarding the data's accuracy, completeness, currency or suitability for any particular purpose; and
(b) do not accept liability howsoever arising, including but not limited to negligence for any loss resulting from the use of or reliance upon the data.

Base data from the LIST © State of Tasmania http://www.thelist.tas.gov.au.
Valuations and Estimates
This estimate is provided by CoreLogic, and is based on statistical market data such as recent local sales, property size, number of bedrooms and many more factors. It comes from public data, which may be incomplete or inaccurate, and should not be used in lieu of a professional appraisal under any circumstances, including for lending purposes or in home loan applications.
School data and Content
Product Data licenced by CoreLogic under a Creative Commons Attribution licence. For details regarding licence, data source, copyright and disclaimers, see https://www.corelogic.com.au/legals/third-party-restrictions
ABS data
This publication contains data and statistics provided by the Australian Bureau of Statistics, available at http://www.abs.gov.au/ and reproduced under Creative Commons Attribution 2.5 http://creativecommons.org/licenses/by/2.5/au/legalcode
Liveability information
The Liveability Score is a rating (out of 10) provided by Propella.ai Pty Ltd as a guide about how "well-connected" properties are in certain local areas. The Liveability Score is based on statistical data about a local area in which a property is located including the distance to and number of available facilities and services (including schools, parklands, health services, shopping and public transport) (Liveability Data). The Liveability Data and Liveability Score has not been verified or confirmed by CoreLogic, is not available for all properties, and is of a general nature and should not be construed as specific advice or relied upon in lieu of appropriate professional advice. Given the relative nature of the Liveability Score, propella.ai anticipate that scores for individual properties will change over time.