
8 Fritton DriveDover TAS 7117
Property Details for 8 Fritton Dr, Dover
8 Fritton Dr, Dover is a 3 bedroom, 2 bathroom House with 1 parking spaces and was built in 2007. The property has a land size of 1346m2 and floor size of 144m2. While the property is not currently for sale or for rent, it was last sold in January 2005.
Last Listing description (October 2018)
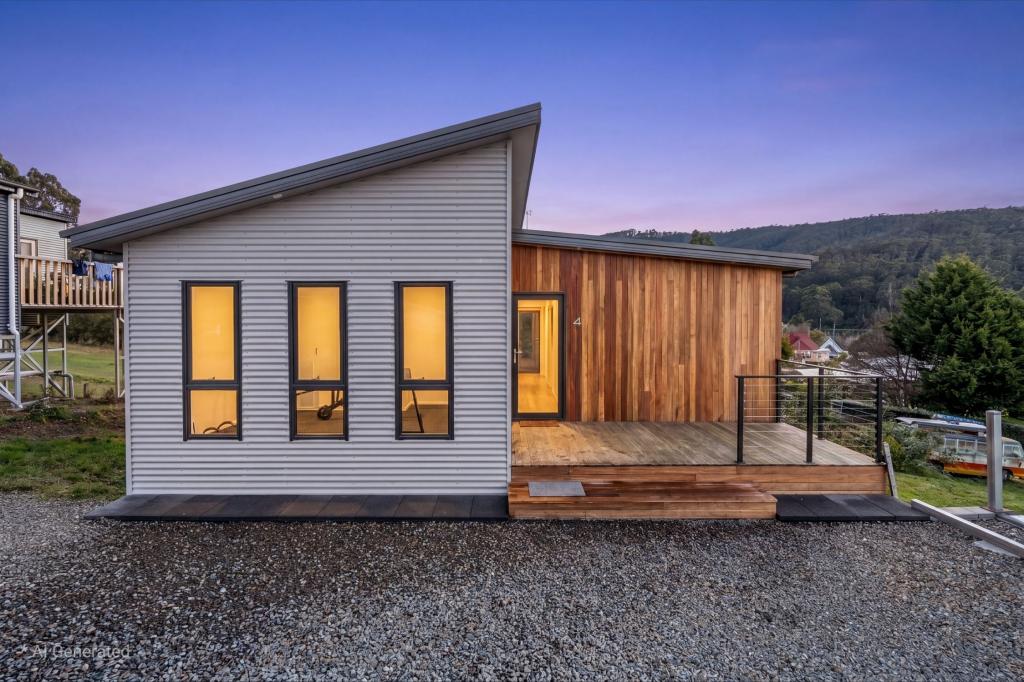
What a Beauty! This lovely modern 3 bedroom, 2 bathroom home is only a stones throw from the safe and calm waters of Kent Beach. Comprising of a spacious open plan living area with a beautiful modern black and white kitchen with stainless steel appliances, breakfast bar and corner pantry. There is a bonus second living area with a study nook which also has a sliding door to the sunny back deck. All bedrooms have built in wardrobes with the main offering a walk in robe and ensuite with shower, vanity and toilet.
The family bathroom is very spacious with a separate bath, corner shower and vanity, the toilet and laundry are separate also.
There are entertaining decks at both the front and the rear of the home and there is a single lock up garage with internal access and auto roller door.
There is a great tenant currently in place until September 2018. This is a fantastic opportunity for you to secure your new home now, reap some rewards and be ready to move in before next Summer.
For more information or to book an inspection, please contact Maree Griggs anytime.
Property History for 8 Fritton Dr, Dover, TAS 7117
- 15 Mar 2018Listed for Sale Offers over $335,000
- 28 Jul 2017Listed for Rent $290 / week
- 16 Jun 2015Listed for Rent $250 / week

Recent sales nearby
See more recent sales nearbySimilar properties For Sale nearby
See more properties for sale nearby 0
0
 0
0 0
0About Dover 7117
The size of Dover is approximately 48.1 square kilometres. There are 8 parks, covering nearly 25.5% of the total area. The population of Dover in 2016 was 854 people. By 2021 the population was 923 showing a population growth of 8.1% in the area during that time. The predominant age group in Dover is 60-69 years. Households in Dover are primarily childless couples and are likely to be repaying $1000 - $1399 per month on mortgage repayments. In general, people in Dover work in a labourer occupation.In 2021, 81.70% of the homes in Dover were owner-occupied compared with 77.30% in 2016.
Dover has 810 properties. Over the last 5 years, Houses in Dover have seen a 29.37% increase in median value, while Units have seen a 152.48% increase. As at 31 May 2026:
- The median value for Houses in Dover is $558,855 while the median value for Units is $357,723.
- Houses have a median rent of $480.
Suburb Insights for Dover 7117
Market Insights
Dover Trends for Houses
N/A
N/A
View TrendN/A
N/A
Dover Trends for Units
N/A
N/A
View TrendN/A
N/A
Neighbourhood Insights
© Copyright 2026. RP Data Pty Ltd trading as Cotality (Cotality). All rights reserved. No reproduction, distribution, or transmission of the copyrighted materials is permitted. The information is deemed reliable but not guaranteed.
While Cotality uses commercially reasonable efforts to ensure the Cotality Data is current, Cotality does not warrant the accuracy, currency or completeness of the Cotality Data and to the full extent permitted by law excludes all loss or damage howsoever arising (including through negligence) in connection with the Cotality Data.
This product uses cookies and other similar technologies to improve and customise your browsing experience, to tailor content and adverts, and for analytics and metrics regarding visitor usage on this product and other media. We may share cookie and analytics information with third parties for the purposes of advertising. By continuing to use our website, you consent to cookies being used. View our Privacy Policy here.
X