
54 Station RoadDover TAS 7117
Property Details for 54 Station Rd, Dover
Last Listing description (April 2025)
Wonderful sunny vacant 526m2 block in the heart of Dover
Superb sought after location close to beach jetty and shops
Massive 108m2 garage tucked into the corner of the block
A scenic 1hr 10 minute drive to Hobart and Salamanca
An exceptional opportunity to build your dream home
Only a few minutes walk to beautiful Dover Beach.
*The information contained herein has been supplied to us and we have no reason to doubt its accuracy, however, we cannot guarantee it. Accordingly, all interested parties should make their own enquiries to verify this information.
Property History for 54 Station Rd, Dover, TAS 7117
- 18 Mar 2025Sold for $250,000
- 12 Mar 2025Listed for Sale Offers in the mid $200,000s
- 23 May 2024Listed for Sale Offers in the mid $200,000s
Recent sales nearby
See more recent sales nearbySimilar properties For Sale nearby
See more properties for sale nearby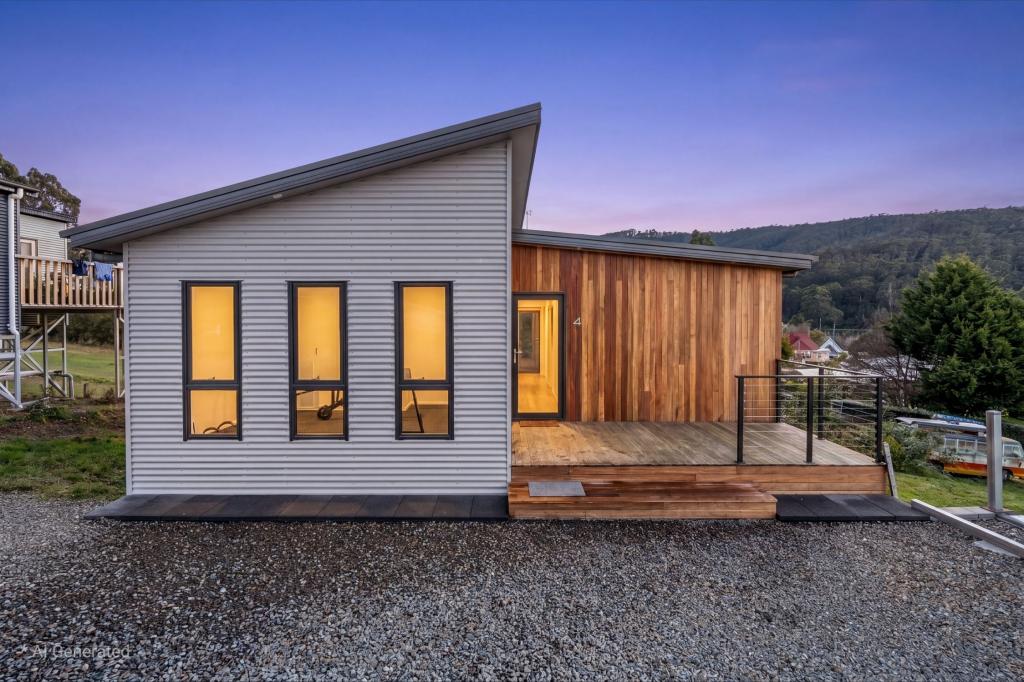 0
0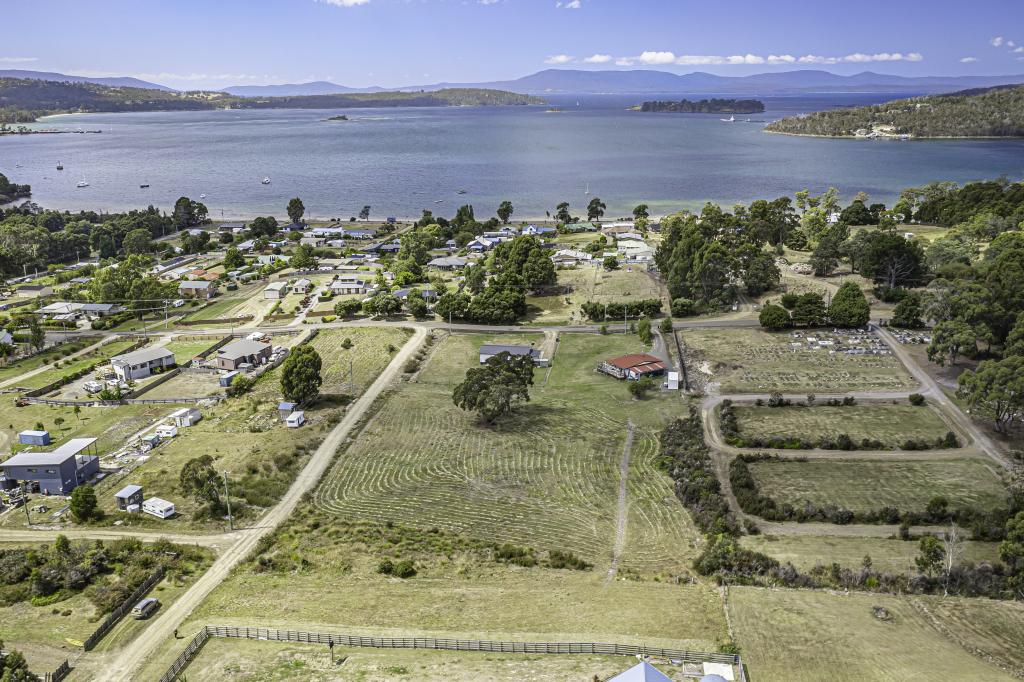 0
0 0
0About Dover 7117
The size of Dover is approximately 48.1 square kilometres. There are 8 parks, covering nearly 25.5% of the total area. The population of Dover in 2016 was 854 people. By 2021 the population was 923 showing a population growth of 8.1% in the area during that time. The predominant age group in Dover is 60-69 years. Households in Dover are primarily childless couples and are likely to be repaying $1000 - $1399 per month on mortgage repayments. In general, people in Dover work in a labourer occupation.In 2021, 81.70% of the homes in Dover were owner-occupied compared with 77.30% in 2016.
Dover has 815 properties. Over the last 5 years, Houses in Dover have seen a 30.71% increase in median value, while Units have seen a 152.48% increase. As at 30 June 2026:
- The median value for Houses in Dover is $565,429 while the median value for Units is $377,305.
- Houses have a median rent of $480.
Suburb Insights for Dover 7117
Market Insights
Dover Trends for Houses
N/A
N/A
View TrendN/A
N/A
Dover Trends for Units
N/A
N/A
View TrendN/A
N/A
Neighbourhood Insights
© Copyright 2026. RP Data Pty Ltd trading as Cotality (Cotality). All rights reserved. No reproduction, distribution, or transmission of the copyrighted materials is permitted. The information is deemed reliable but not guaranteed.
While Cotality uses commercially reasonable efforts to ensure the Cotality Data is current, Cotality does not warrant the accuracy, currency or completeness of the Cotality Data and to the full extent permitted by law excludes all loss or damage howsoever arising (including through negligence) in connection with the Cotality Data.
This product uses cookies and other similar technologies to improve and customise your browsing experience, to tailor content and adverts, and for analytics and metrics regarding visitor usage on this product and other media. We may share cookie and analytics information with third parties for the purposes of advertising. By continuing to use our website, you consent to cookies being used. View our Privacy Policy here.
X