
340 Cockerills RoadBoyer TAS 7140
Property Details for 340 Cockerills Rd, Boyer
340 Cockerills Rd, Boyer is a 0 bedroom, 0 bathroom House with 4 parking spaces and was built in 2011. The property has a land size of 271073m2 and floor size of 150m2. While the property is not currently for sale or for rent, it was last sold in October 2016.
Last Listing description (November 2016)
Set in the foothills of Boyer this bush block measures approximately 66 acres.
There was previously a residential dwelling on the cleared section of land, this has been removed. The concrete slab is still in place which is a bonus. To erect a new dwelling a buyer would have to gain council approval.
If you are looking for some land and love getting away from the city hustle and bustle for the weekend this block would be perfect.
Property History for 340 Cockerills Rd, Boyer, TAS 7140
- 28 Oct 2016Sold for $65,000
- 12 Sep 2016Listed for Sale $80,000
- 27 Sep 2013Sold for $20

Recent sales nearby
See more recent sales nearby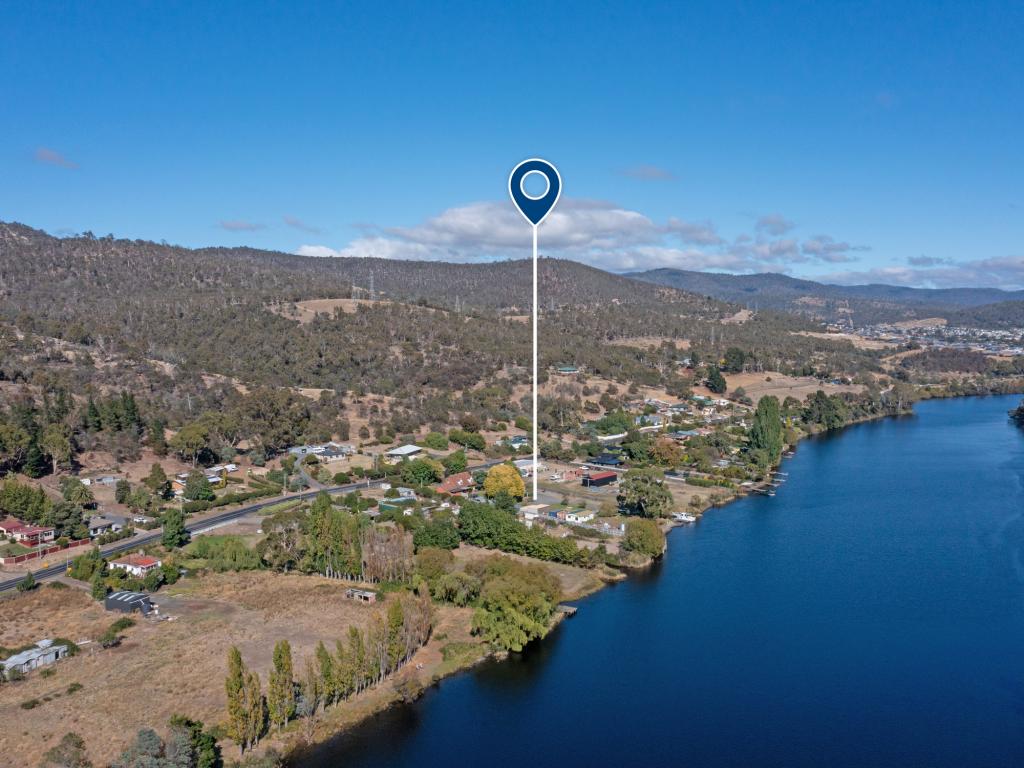 0
0About Boyer 7140
The size of Boyer is approximately 11.7 square kilometres. There are 2 parks, covering nearly 0.3% of the total area. The population of Boyer in 2016 was 40 people. By 2021 the population was 58 showing a population growth of 45.0% in the area during that time. The predominant age group in Boyer is 0-9 years. Households in Boyer are primarily couples with children and are likely to be repaying $1000 - $1399 per month on mortgage repayments. In general, people in Boyer work in a trades occupation.In 2021, 62.50% of the homes in Boyer were owner-occupied compared with 100.00% in 2016.
Boyer has 31 properties. Over the last 5 years, Houses in Boyer have seen a 49.55% increase in median value. As at 30 June 2026:
- The median value for Houses in Boyer is $766,684.
Suburb Insights for Boyer 7140
Market Insights
Boyer Trends for Houses
N/A
N/A
View TrendN/A
N/A
Boyer Trends for Units
N/A
N/A
View TrendN/A
N/A
Neighbourhood Insights
© Copyright 2026. RP Data Pty Ltd trading as Cotality (Cotality). All rights reserved. No reproduction, distribution, or transmission of the copyrighted materials is permitted. The information is deemed reliable but not guaranteed.
While Cotality uses commercially reasonable efforts to ensure the Cotality Data is current, Cotality does not warrant the accuracy, currency or completeness of the Cotality Data and to the full extent permitted by law excludes all loss or damage howsoever arising (including through negligence) in connection with the Cotality Data.
This product uses cookies and other similar technologies to improve and customise your browsing experience, to tailor content and adverts, and for analytics and metrics regarding visitor usage on this product and other media. We may share cookie and analytics information with third parties for the purposes of advertising. By continuing to use our website, you consent to cookies being used. View our Privacy Policy here.
X