
2/7 Musgrave AvenueWest Hindmarsh SA 5007
Property Details for 2/7 Musgrave Ave, West Hindmarsh
2/7 Musgrave Ave, West Hindmarsh is a 2 bedroom, 1 bathroom Unit with 1 parking spaces and was built in 1971. The property has a land size of 87m2 and floor size of 55m2. While the property is not currently for sale or for rent, it was last sold in March 2024.
Last Listing description (March 2024)
Currently tenanted until November 2024 at $390 per week. Photos used for advertising were from when the home was leased
Conveniently located less than 400 meters from Brickworks Shopping Centre and the picturesque Torrens Linear Park walking trail, this 1970s-built 2-bedroom unit is nestled in a small group of only 3. The nearby shopping centre provides easy access to a variety of shops, cafes, and amenities, while the tranquil walking trail offers a peaceful retreat for outdoor enthusiasts. This property presents an ideal opportunity to enjoy a balanced lifestyle, with the best of both worlds right at your doorstep.
Featuring:
Comfortable living space and polished timber floors throughout
Updated kitchen with Dishwasher
Updated Bathroom and separate laundry
2 bedrooms both with built in robes and ceiling fans
Private paved rear yard
Split System air conditioning
Carport
Just moments from home find the Entertainment Centre, The Gov and many other restaurants, eateries, pubs, and boutiques along Port Road. Not to mention a short bike ride away from Bowden's ever-popular Plant 3 & Plant 4 - It isn't hard to see why the inner-west is so in demand.
Property History for 2/7 Musgrave Ave, West Hindmarsh, SA 5007
- 28 Mar 2024Sold for $460,000
- 14 Feb 2024Listed for Sale CONTACT AGENT
- 01 Nov 2022Listed for Rent $340 / week

Recent sales nearby
See more recent sales nearbySimilar properties For Sale nearby
See more properties for sale nearby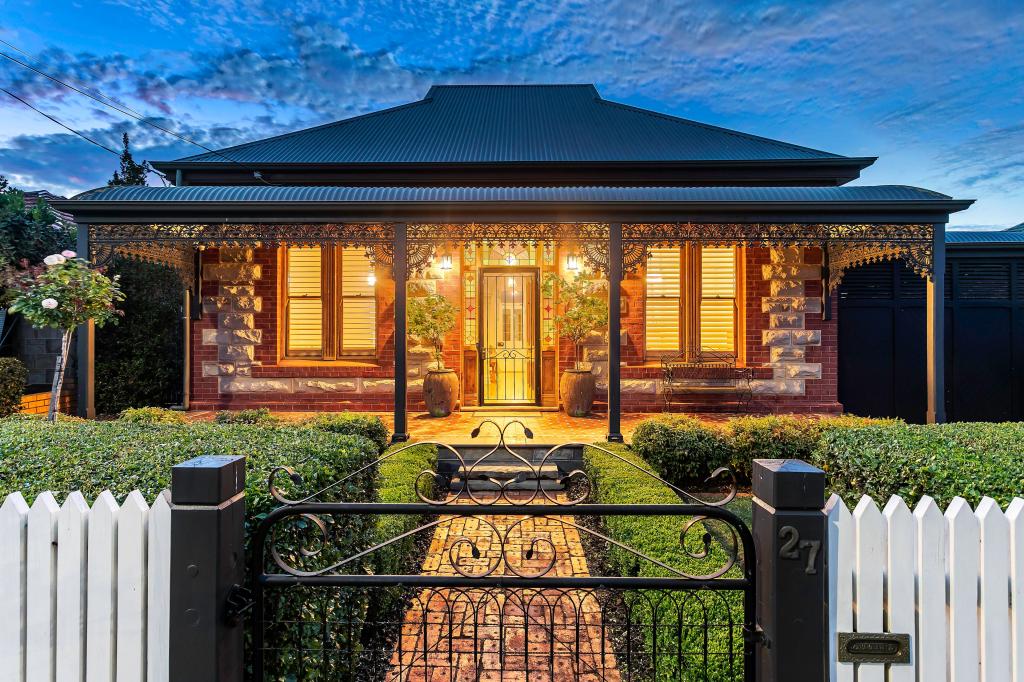 0
0
 0
0 0
0Similar properties For Rent nearby
See more properties for rent nearby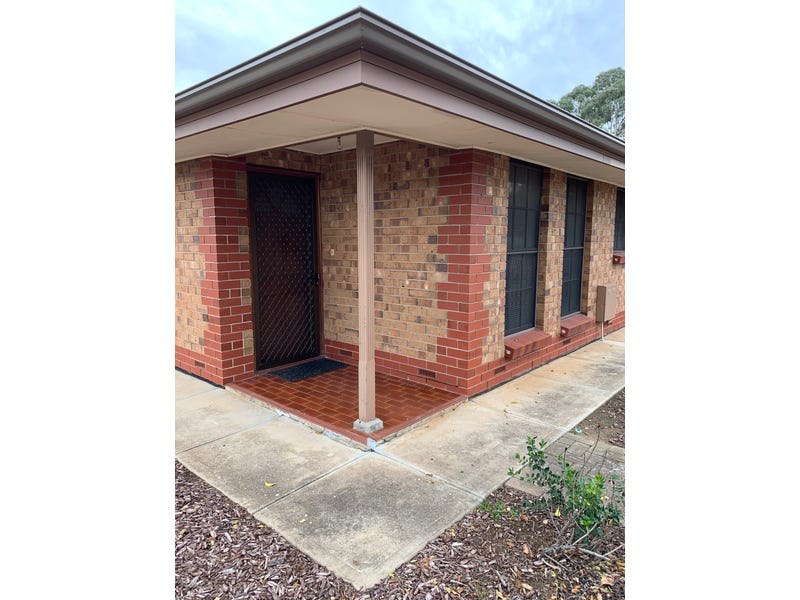 0
0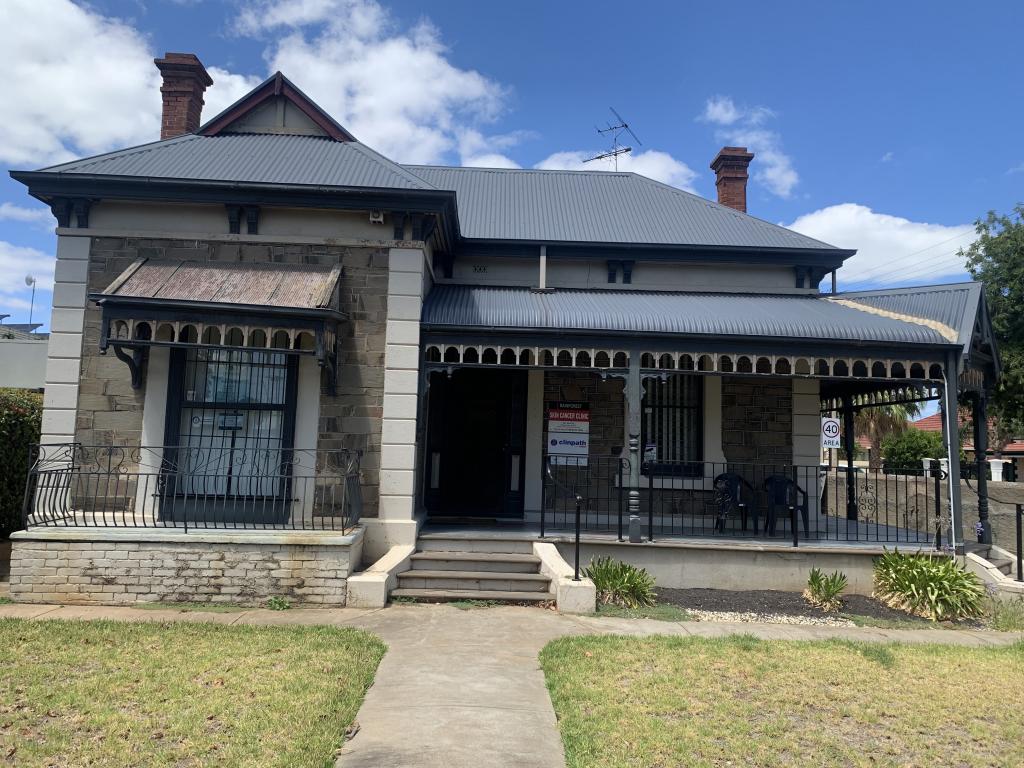 0
0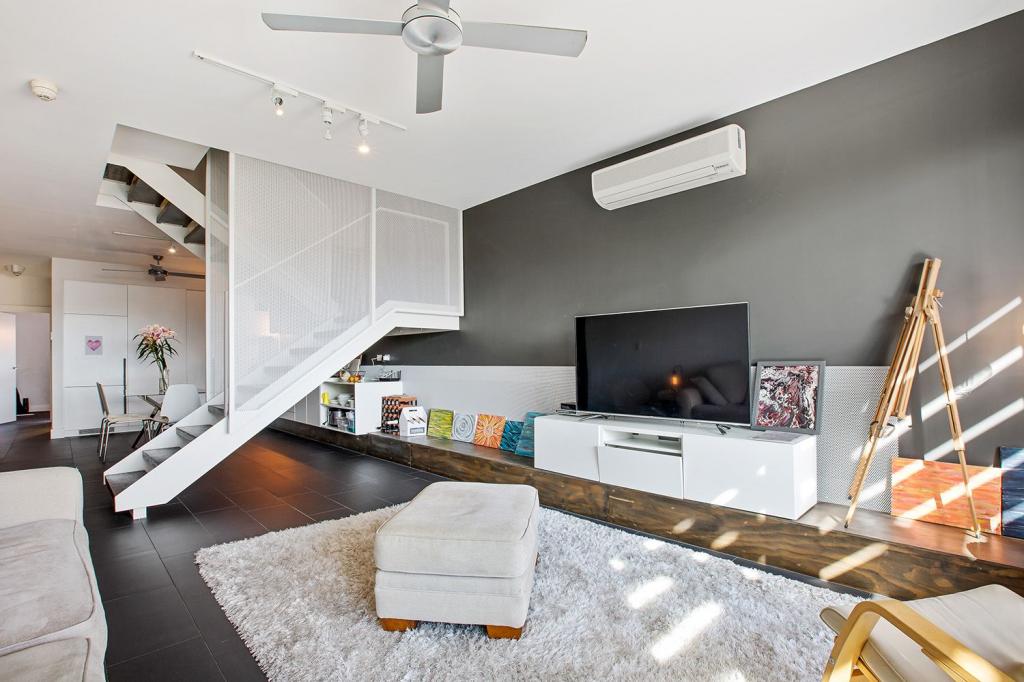 0
0About West Hindmarsh 5007
The size of West Hindmarsh is approximately 0.6 square kilometres. It has 2 parks covering nearly 1.8% of total area. The population of West Hindmarsh in 2016 was 1535 people. By 2021 the population was 1560 showing a population growth of 1.6% in the area during that time. The predominant age group in West Hindmarsh is 30-39 years. Households in West Hindmarsh are primarily childless couples and are likely to be repaying $1800 - $2399 per month on mortgage repayments. In general, people in West Hindmarsh work in a professional occupation.In 2021, 57.90% of the homes in West Hindmarsh were owner-occupied compared with 58.80% in 2016.
West Hindmarsh has 817 properties. Over the last 5 years, Houses in West Hindmarsh have seen a 92.87% increase in median value, while Units have seen a 108.43% increase. As at 30 April 2026:
- The median value for Houses in West Hindmarsh is $1,244,843 while the median value for Units is $729,250.
- Houses have a median rent of $650 while Units have a median rent of $428.
Suburb Insights for West Hindmarsh 5007
Market Insights
West Hindmarsh Trends for Houses
N/A
N/A
View TrendN/A
N/A
West Hindmarsh Trends for Units
N/A
N/A
View TrendN/A
N/A
Neighbourhood Insights
© Copyright 2026. RP Data Pty Ltd trading as Cotality (Cotality). All rights reserved. No reproduction, distribution, or transmission of the copyrighted materials is permitted. The information is deemed reliable but not guaranteed.
While Cotality uses commercially reasonable efforts to ensure the Cotality Data is current, Cotality does not warrant the accuracy, currency or completeness of the Cotality Data and to the full extent permitted by law excludes all loss or damage howsoever arising (including through negligence) in connection with the Cotality Data.
This product uses cookies and other similar technologies to improve and customise your browsing experience, to tailor content and adverts, and for analytics and metrics regarding visitor usage on this product and other media. We may share cookie and analytics information with third parties for the purposes of advertising. By continuing to use our website, you consent to cookies being used. View our Privacy Policy here.
X