
5017 Main South RoadMyponga SA 5202
Property Details for 5017 Main South Rd, Myponga
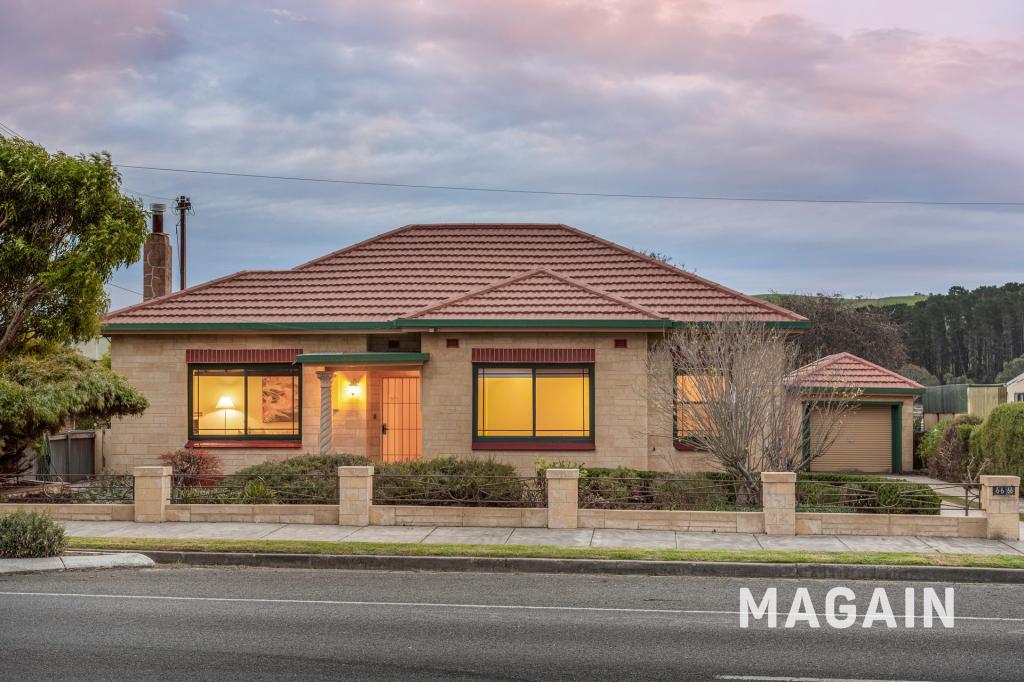
5017 Main South Rd, Myponga is a 3 bedroom, 3 bathroom House with 4 parking spaces and was built in 1965. The property has a land size of 1265m2 and floor size of 166m2. While the property is not currently for sale or for rent, it was last sold in December 2018.
Last Listing description (December 2018)
Under Contract before being placed on the market. I pride myself on being a Myponga local resident and knowing many local sellers and buyers. Stay ahead of the rest and make contact with me and register as a local buyer and seller in the Myponga area and how you can also win back your sales commission when you list and sell with Shane Magor @realty. Shane Magor @realty - 67 Beach Road, Christies Beach SA 5165 - PO Box 66, Sellicks Beach SA 5174
Property History for 5017 Main South Rd, Myponga, SA 5202
- 10 Dec 2018Sold for $270,000
- 07 Dec 2018Sold for $270,000
- 16 Oct 2018Listed for Sale Contact Agent

Recent sales nearby
See more recent sales nearby
 0
0About Myponga 5202
The size of Myponga is approximately 89.5 square kilometres. There are 4 parks, covering nearly 2.4% of the total area. The population of Myponga in 2016 was 744 people. By 2021 the population was 771 showing a population growth of 3.6% in the area during that time. The predominant age group in Myponga is 0-9 years. Households in Myponga are primarily couples with children and are likely to be repaying $1000 - $1399 per month on mortgage repayments. In general, people in Myponga work in a labourer occupation.In 2021, 87.60% of the homes in Myponga were owner-occupied compared with 80.80% in 2016.
Myponga has 471 properties. Over the last 5 years, Houses in Myponga have seen a 91.98% increase in median value. As at 31 May 2026:
- The median value for Houses in Myponga is $967,993.
- Houses have a median rent of $290.
Suburb Insights for Myponga 5202
Market Insights
Myponga Trends for Houses
N/A
N/A
View TrendN/A
N/A
Myponga Trends for Units
N/A
N/A
View TrendN/A
N/A
Neighbourhood Insights
© Copyright 2026. RP Data Pty Ltd trading as Cotality (Cotality). All rights reserved. No reproduction, distribution, or transmission of the copyrighted materials is permitted. The information is deemed reliable but not guaranteed.
While Cotality uses commercially reasonable efforts to ensure the Cotality Data is current, Cotality does not warrant the accuracy, currency or completeness of the Cotality Data and to the full extent permitted by law excludes all loss or damage howsoever arising (including through negligence) in connection with the Cotality Data.
This product uses cookies and other similar technologies to improve and customise your browsing experience, to tailor content and adverts, and for analytics and metrics regarding visitor usage on this product and other media. We may share cookie and analytics information with third parties for the purposes of advertising. By continuing to use our website, you consent to cookies being used. View our Privacy Policy here.
X