
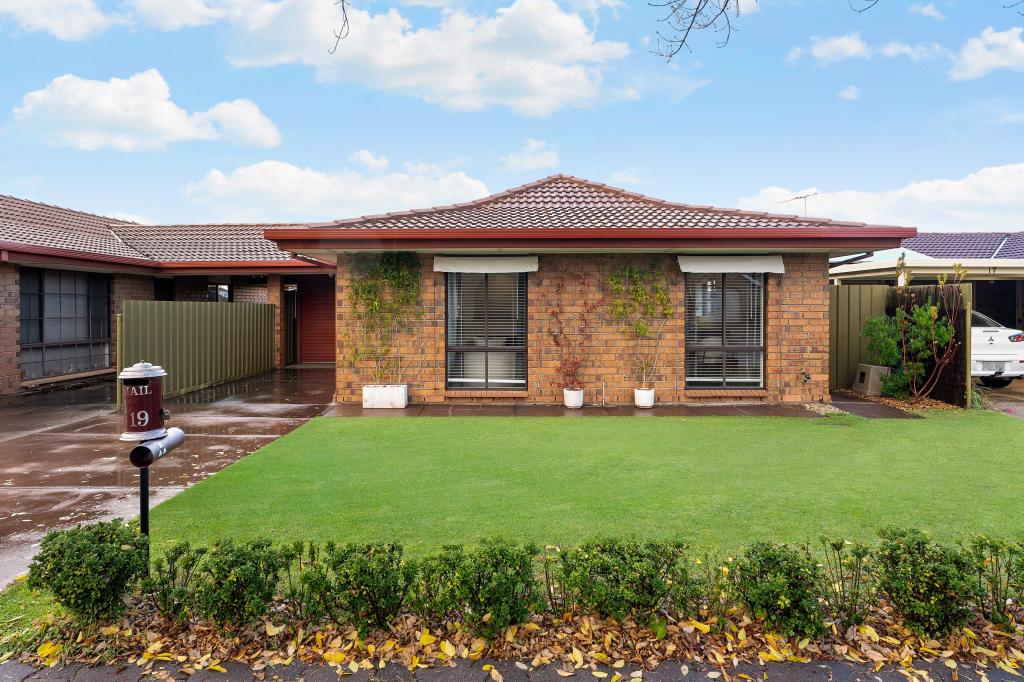
5 Manningham StreetManningham SA 5086
Property Details for 5 Manningham St, Manningham
5 Manningham St, Manningham is a 3 bedroom, 1 bathroom House with 2 parking spaces and was built in 1967. While the property is not currently for sale or for rent, it was last transferred in October 2021.
Last Listing description (March 2025)
2-Bedroom House with External 3rd Bedroom Option, Close to the City!
$600 per week
This sleek home in tranquil Manningham offers 2 bedrooms in the main house plus an external rumpus room that doubles as a 3rd bedroom, ideal for professionals needing a quick 10-minute commute to the CBD (20 by bus) or retirees seeking a peaceful spot near Adelaides action.
What You Get:
* Ducted A/C + split-system for all-season comfort
* 7.8kW solar to cut power bills
* NBN connected
* Gas heater to keep you warm on chilly nights
* 4 car spots: 2 in secure carport, 2 on driveway
* Roller door for privacy
* 2 bedrooms inside, plus external rumpus room (or 3rd bedroom 4.8m x 6.0m)
* Workshop
* Big verandah for drinks or downtime
* Large backyard (pets negotiable)
Location Highlights:
* 10-min drive or 20-min bus to the CBD
* Quiet streets with friendly neighbours
* Walk to Woolworths Walkerville or Coles Greenacres
* Near St Andrews, Wilderness, St Monicas, Vale Park Primary, and Roma Mitchell Secondary
* 10 mins to Adelaide Oval for sports and concerts
* 10 mins to Adelaide Botanic Gardens for a nature fix
* Close to North Adelaide, Norwood, and Prospects cafes and shops
* 15 mins to Burnside Village Shopping Centre and Rundle Mall
* Yolk Caf and River Torrens walks via Linear Park Trail nearby
* Tea Tree Plaza in 20 mins
Lease Terms:
* $600/week
* 6-month lease (negotiable)
* 4 weeks rent upfront, lodged with tribunal
* Unfurnished
* Includes 1 De'Longhi 3.3kW portable air conditioner for the external rumpus room (or 3rd bedroom) (optional)
* Tenant pays water, gas, electricity
* Tenant maintains gardens
* Pets okay (with approval)
A quiet escape with city perksenquire now!
Property History for 5 Manningham St, Manningham, SA 5086
- 13 Mar 2025Listed for Rent $600 per week

Recent sales nearby
See more recent sales nearbySimilar properties For Sale nearby
See more properties for sale nearby
 0
0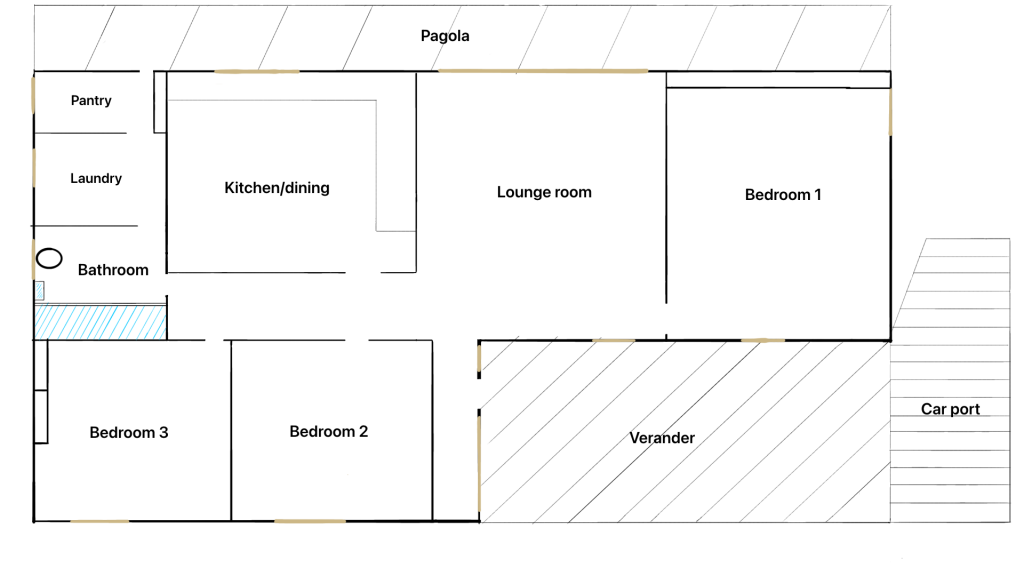 0
0 0
0Similar properties For Rent nearby
See more properties for rent nearby 0
0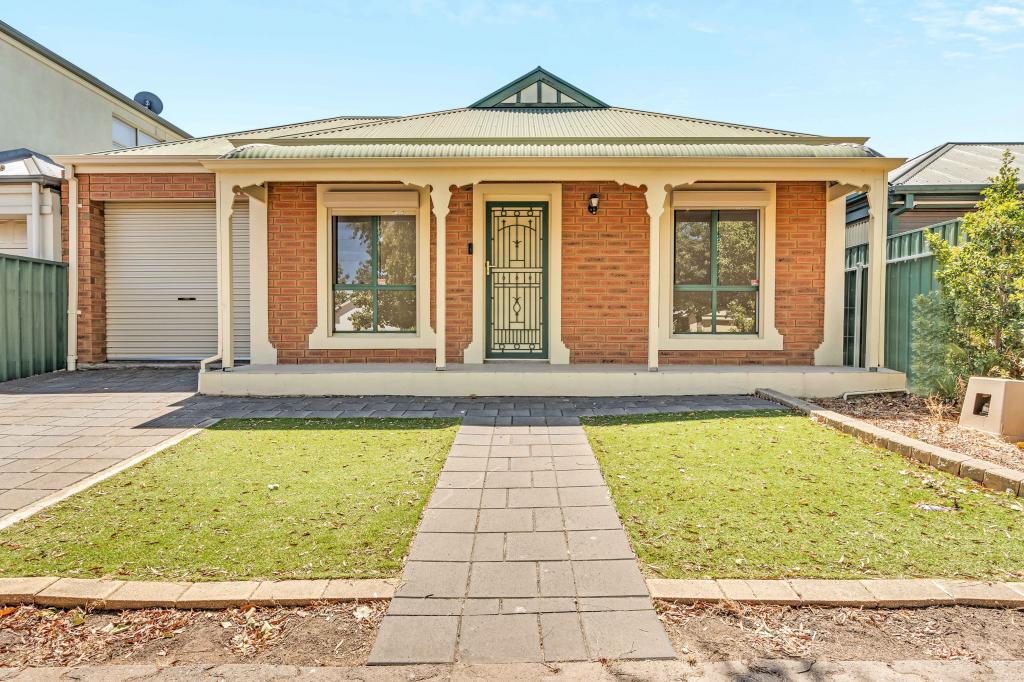 0
0 0
0About Manningham 5086
The size of Manningham is approximately 0.6 square kilometres. There are 2 parks, covering nearly 4.4% of the total area. The population of Manningham in 2016 was 1325 people. By 2021 the population was 1391 showing a population growth of 5.0% in the area during that time. The predominant age group in Manningham is 30-39 years. Households in Manningham are primarily couples with children and are likely to be repaying $1800 - $2399 per month on mortgage repayments. In general, people in Manningham work in a professional occupation.In 2021, 71.80% of the homes in Manningham were owner-occupied compared with 72.90% in 2016.
Manningham has 639 properties. Over the last 5 years, Houses in Manningham have seen a 92.36% increase in median value, while Units have seen a 144.14% increase. As at 31 May 2026:
- The median value for Houses in Manningham is $1,178,676 while the median value for Units is $597,615.
- Houses have a median rent of $630 while Units have a median rent of $450.
Suburb Insights for Manningham 5086
Market Insights
Manningham Trends for Houses
N/A
N/A
View TrendN/A
N/A
Manningham Trends for Units
N/A
N/A
View TrendN/A
N/A
Neighbourhood Insights
© Copyright 2026. RP Data Pty Ltd trading as Cotality (Cotality). All rights reserved. No reproduction, distribution, or transmission of the copyrighted materials is permitted. The information is deemed reliable but not guaranteed.
While Cotality uses commercially reasonable efforts to ensure the Cotality Data is current, Cotality does not warrant the accuracy, currency or completeness of the Cotality Data and to the full extent permitted by law excludes all loss or damage howsoever arising (including through negligence) in connection with the Cotality Data.
This product uses cookies and other similar technologies to improve and customise your browsing experience, to tailor content and adverts, and for analytics and metrics regarding visitor usage on this product and other media. We may share cookie and analytics information with third parties for the purposes of advertising. By continuing to use our website, you consent to cookies being used. View our Privacy Policy here.
X