
57 Tusmore AvenueLeabrook SA 5068
Property Details for 57 Tusmore Ave, Leabrook
57 Tusmore Ave, Leabrook is a 5 bedroom, 4 bathroom House with 2 parking spaces and was built in 1925. The property has a land size of 1342m2 and floor size of 391m2. While the property is not currently for sale or for rent, it was last sold in November 2024.
Last Listing description (May 2014)
-500sqm approx of living
-5 bedrooms
-Bay window formal dining
-Award winning kitchen with Miele appliances
-Huge family/meals room
-4 bathrooms
-Cellar
-Central courtyard with water feature
-Outdoor kitchen with with BBQ and pizza oven
-Heated outdoor pool
-Ducted r/c air conditioning
-Electric gates and excellent off street parking
-Camera intercom
-Security system
Property History for 57 Tusmore Ave, Leabrook, SA 5068
- 15 Nov 2024Sold for $3,550,000
- 14 Feb 2023Sold for $2,712,500
- 27 Jun 2014Sold for $2,100,000

Recent sales nearby
See more recent sales nearbySimilar properties For Sale nearby
See more properties for sale nearby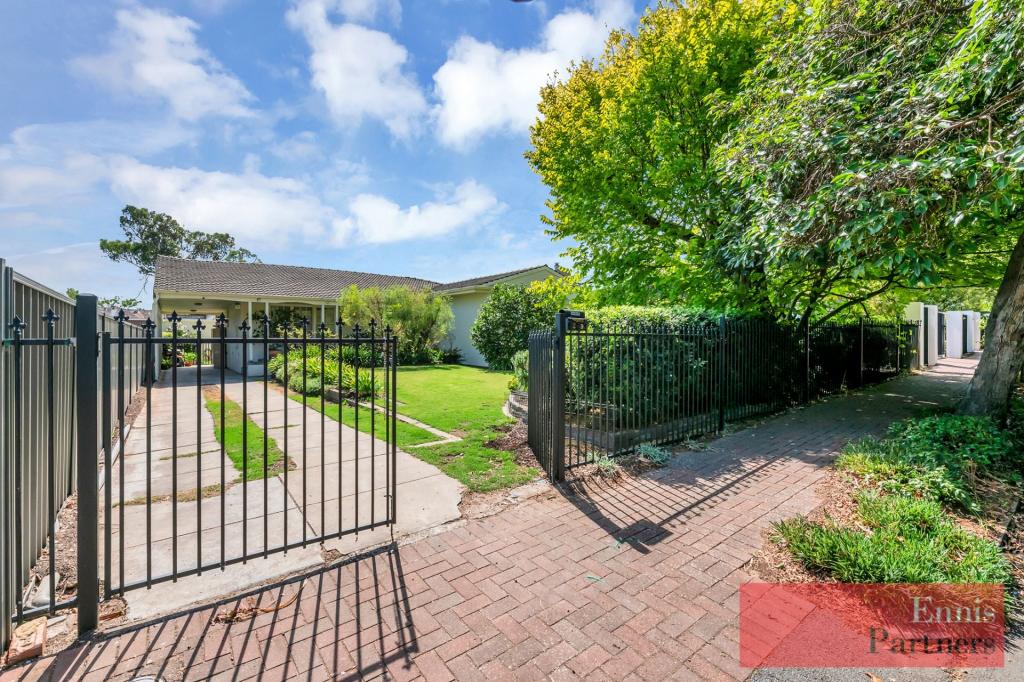 0
0
 0
0 0
0Similar properties For Rent nearby
See more properties for rent nearby 0
0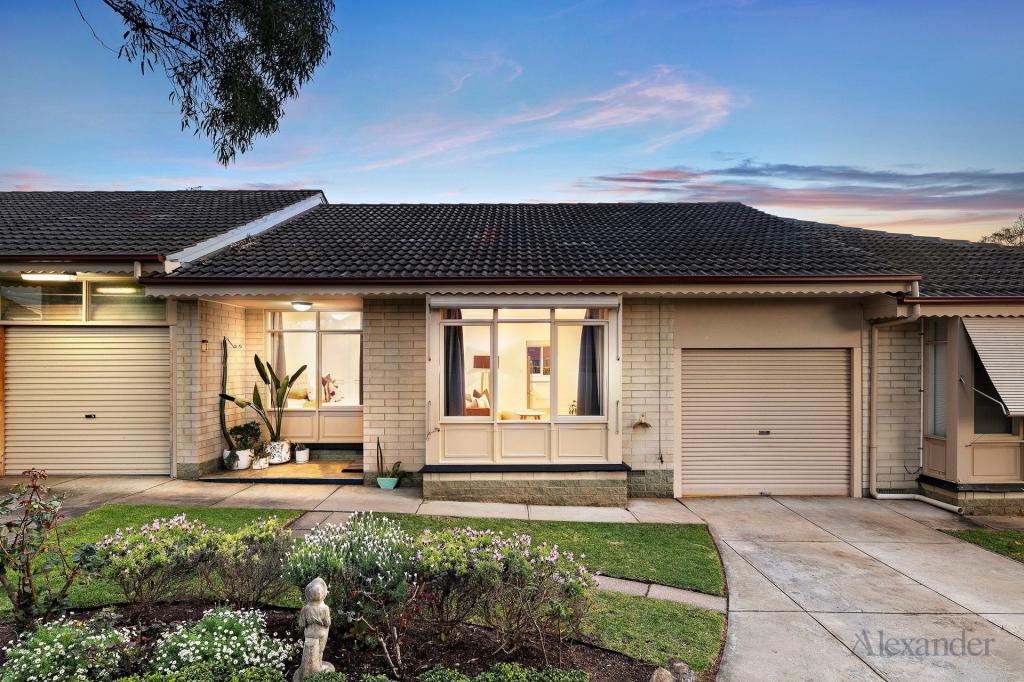 0
0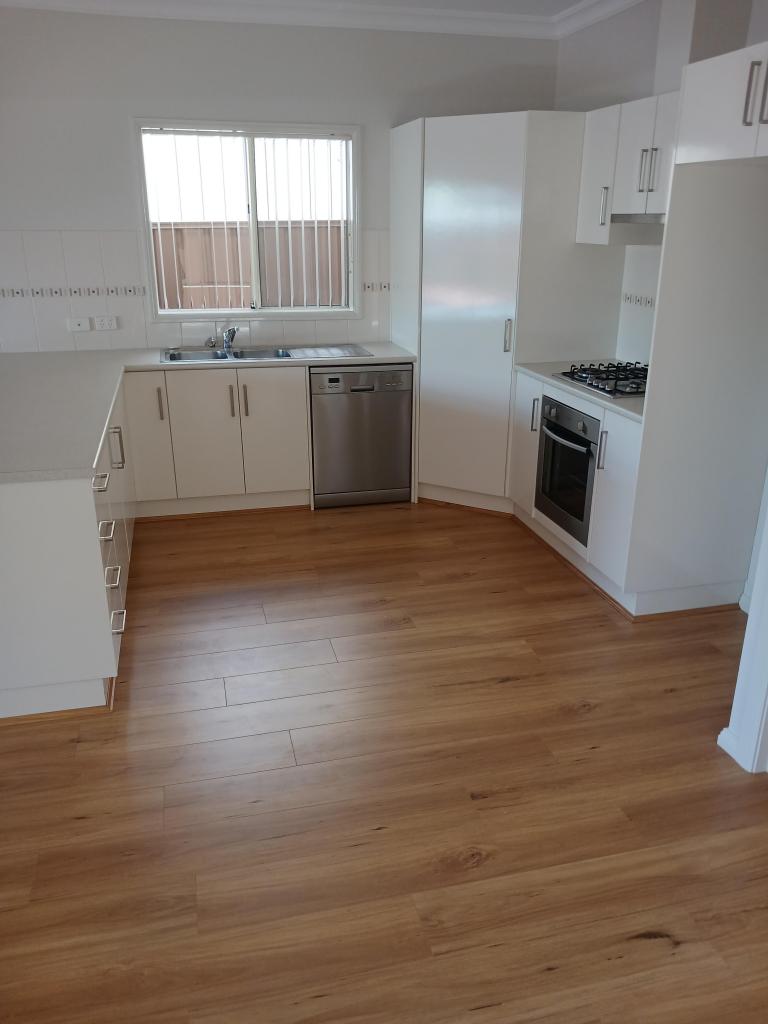 0
0About Leabrook 5068
The size of Leabrook is approximately 0.6 square kilometres. There are 4 parks, covering nearly 2.6% of the total area. The population of Leabrook in 2016 was 1574 people. By 2021 the population was 1605 showing a population growth of 2.0% in the area during that time. The predominant age group in Leabrook is 80-89 years. Households in Leabrook are primarily childless couples and are likely to be repaying over $4000 per month on mortgage repayments. In general, people in Leabrook work in a professional occupation.In 2021, 60.50% of the homes in Leabrook were owner-occupied compared with 60.70% in 2016.
Leabrook has 627 properties. Over the last 5 years, Houses in Leabrook have seen a 66.50% increase in median value, while Units have seen a 93.80% increase. As at 31 May 2026:
- The median value for Houses in Leabrook is $2,663,284 while the median value for Units is $741,372.
- Houses have a median rent of $823 while Units have a median rent of $523.
Suburb Insights for Leabrook 5068
Market Insights
Leabrook Trends for Houses
N/A
N/A
View TrendN/A
N/A
Leabrook Trends for Units
N/A
N/A
View TrendN/A
N/A
Neighbourhood Insights
© Copyright 2026. RP Data Pty Ltd trading as Cotality (Cotality). All rights reserved. No reproduction, distribution, or transmission of the copyrighted materials is permitted. The information is deemed reliable but not guaranteed.
While Cotality uses commercially reasonable efforts to ensure the Cotality Data is current, Cotality does not warrant the accuracy, currency or completeness of the Cotality Data and to the full extent permitted by law excludes all loss or damage howsoever arising (including through negligence) in connection with the Cotality Data.
This product uses cookies and other similar technologies to improve and customise your browsing experience, to tailor content and adverts, and for analytics and metrics regarding visitor usage on this product and other media. We may share cookie and analytics information with third parties for the purposes of advertising. By continuing to use our website, you consent to cookies being used. View our Privacy Policy here.
X