
9 Bode StreetHenley Beach South SA 5022
Property Details for 9 Bode St, Henley Beach South
9 Bode St, Henley Beach South is a 3 bedroom, 1 bathroom House with 2 parking spaces and was built in 1958. The property has a land size of 724m2 and floor size of 100m2. While the property is not currently for sale or for rent, it was last sold in June 2022.
Last Listing description (May 2022)
[BLANK CANVAS]
A genuine opportunity.
Set within the quiet streets of Henley Beach South.
With all the scope you could hope for.
Call the builder; Your project awaits.
[LETS TAKE A LOOK THROUGH]
* Solid brick home with tiled roof.
* Timber floorboards hiding under the carpet [hello character].
* Entrance porch provides an undercover landing for greeting your guests.
* The front door leads into the main living room.
* Wall mounted air conditioning for all year comfort.
* To the south side of the home is the accommodation wing.
* Three genuine sized bedrooms.
* Bathroom with separate toilet room.
* The Kitchen is a perfect example of how well kept this home is.
* All cabinetry is in great condition.
* The rear lean-to provides your internal laundry facilities.
* Leading to the undercover outdoor entertaining area.
* Fully fenced yard, perfectly private and secure.
* Complete with garden shed and garage.
[* There is also a sneaky wine cellar in the shedding as well].
* Undercover carport and driveway for further parking.
A wonderful blank canvas for your imagine to run wild.
[PROPERTY SPECIFICS]
Council: Charles Sturt
Council Rates: $2033 per annum
ESL: $190 per annum
SA Water: $226 per qtr
Year Built: c1958
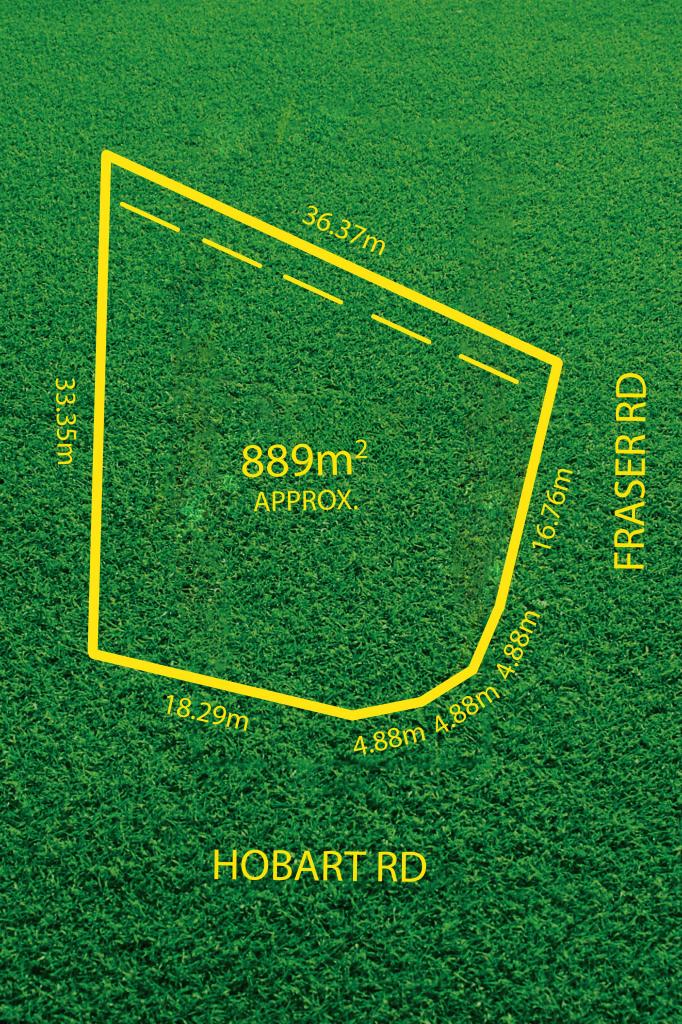
Land Size: 720sqm
Frontage: 18.5m
[approx costings and measurements]
BHEN&CO Real Estate RLA 291652
Property History for 9 Bode St, Henley Beach South, SA 5022
- 02 Jun 2022Sold for $1,017,000
- 19 Apr 2022Listed for Sale [Contact Agent]
- 20 Dec 2018Transferred

Recent sales nearby
See more recent sales nearbySimilar properties For Sale nearby
See more properties for sale nearby
 0
0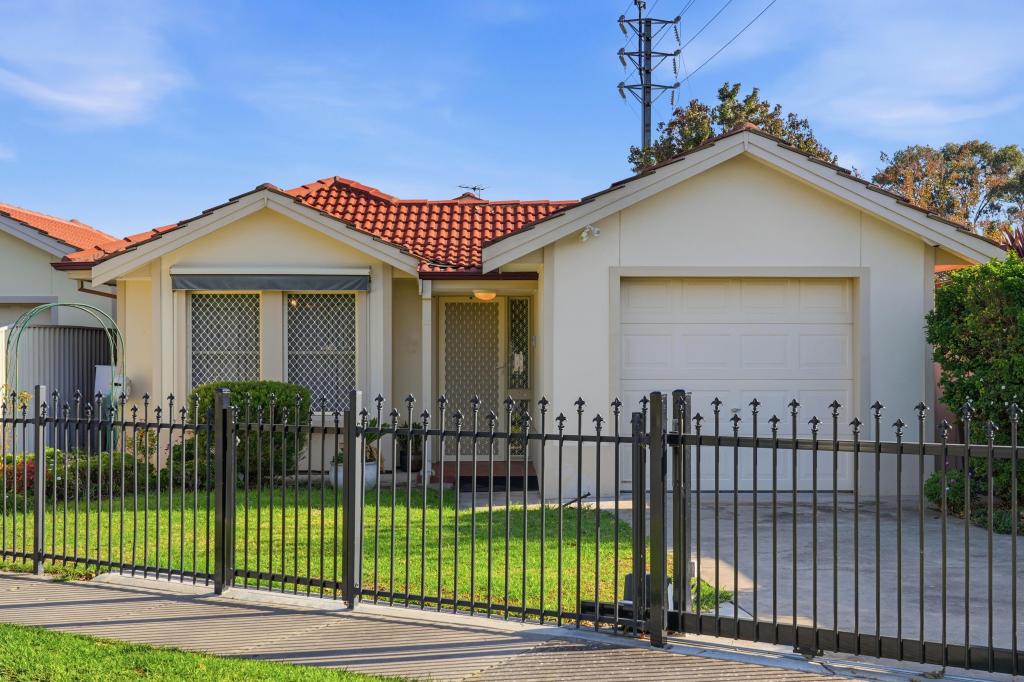 0
0 0
0Similar properties For Rent nearby
See more properties for rent nearby 0
0 0
0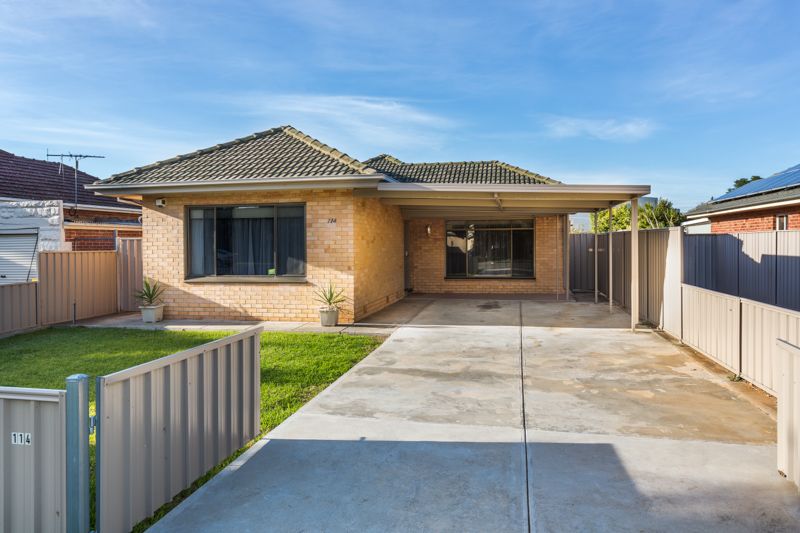 0
0About Henley Beach South 5022
The size of Henley Beach South is approximately 1.1 square kilometres. There are 5 parks, covering nearly 10.1% of the total area. The population of Henley Beach South in 2016 was 2673 people. By 2021 the population was 2799 showing a population growth of 4.7% in the area during that time. The predominant age group in Henley Beach South is 50-59 years. Households in Henley Beach South are primarily couples with children and are likely to be repaying $1800 - $2399 per month on mortgage repayments. In general, people in Henley Beach South work in a professional occupation.In 2021, 71.10% of the homes in Henley Beach South were owner-occupied compared with 63.00% in 2016.
Henley Beach South has 1,371 properties. Over the last 5 years, Houses in Henley Beach South have seen a 62.41% increase in median value, while Units have seen a 112.35% increase. As at 30 April 2026:
- The median value for Houses in Henley Beach South is $1,767,444 while the median value for Units is $721,135.
- Houses have a median rent of $850 while Units have a median rent of $520.
Suburb Insights for Henley Beach South 5022
Market Insights
Henley Beach South Trends for Houses
N/A
N/A
View TrendN/A
N/A
Henley Beach South Trends for Units
N/A
N/A
View TrendN/A
N/A
Neighbourhood Insights
© Copyright 2026. RP Data Pty Ltd trading as Cotality (Cotality). All rights reserved. No reproduction, distribution, or transmission of the copyrighted materials is permitted. The information is deemed reliable but not guaranteed.
While Cotality uses commercially reasonable efforts to ensure the Cotality Data is current, Cotality does not warrant the accuracy, currency or completeness of the Cotality Data and to the full extent permitted by law excludes all loss or damage howsoever arising (including through negligence) in connection with the Cotality Data.
This product uses cookies and other similar technologies to improve and customise your browsing experience, to tailor content and adverts, and for analytics and metrics regarding visitor usage on this product and other media. We may share cookie and analytics information with third parties for the purposes of advertising. By continuing to use our website, you consent to cookies being used. View our Privacy Policy here.
X