4/39 Cudmore TerraceHenley Beach SA 5022
Property Details for 4/39 Cudmore Tce, Henley Beach
4/39 Cudmore Tce, Henley Beach is a 2 bedroom, 1 bathroom Unit with 1 parking spaces and was built in 1976. The property has a floor size of 60m2.
Last Listing description (December 2021)
**OPEN INSPECTION BOOKED FOR THURSDAY 25TH MARCH 2021 BETWEEN 5:00 P.M. - 5:15 P.M.
* ALL ATTENDEES MUST EMAIL AGENT TO REGISTER FOR INSPECTION *
A neat and tidy two bedroom unit in small group of six. Offering two bedrooms, large lounge, good size eat in kitchen, bathroom with toilet, separate laundry and undercover car parking. The unit is situated opposite St. Michaels College oval with a five minute walk to the beach. Close to West Lakes and Target shopping centres and public transport out the front.
REGISTRATION REQUIRED TO VIEW THIS PROPERTY
Property History for 4/39 Cudmore Tce, Henley Beach, SA 5022
- 18 Mar 2021Listed for Rent $325 / week
- 18 Jun 2018Listed for Rent - Price not available
- 26 Apr 2017Listed for Rent - Price not available

Recent sales nearby
See more recent sales nearby/assets/perm/exdjdb3qtui63pz6p5677k7tyi?signature=06b80369d048c6421a38e4431f563c78f7fae57271235670253014868df5449f) 0
0
/assets/perm/kq5x4lf6rui6nlkcyuypjvvuru?signature=20ae032b55c2b5dac76cc36cf7d95572647c5b9a9ddeebad393accd2ddbe02fb) 0
0
/assets/perm/h2sgva56cii6nkztufg6q33w7q?signature=6a2f17d3507c806e16b735cc89a932e597c4e2bf1dac73e7cb3fe116ecb37d00) 0
0Similar properties For Sale nearby
See more properties for sale nearby 0
0

 0
0
 0
0Similar properties For Rent nearby
See more properties for rent nearby 0
0 0
0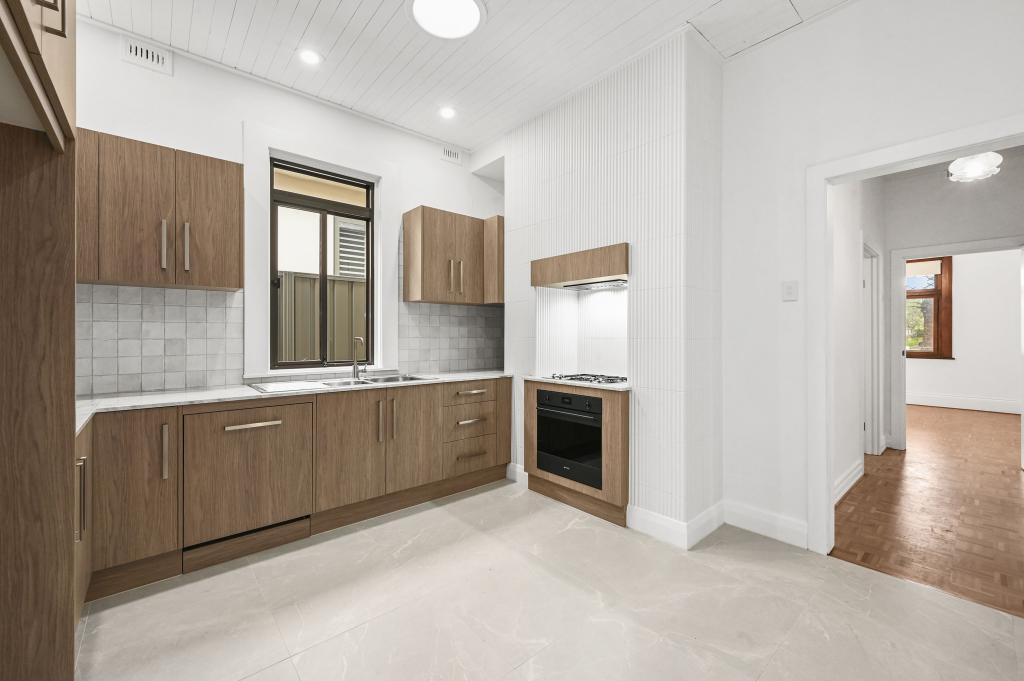 0
0About Henley Beach 5022
The size of Henley Beach is approximately 2.7 square kilometres. There are 9 parks, covering nearly 8.5% of the total area. The population of Henley Beach in 2016 was 5988 people. By 2021 the population was 6259 showing a population growth of 4.5% in the area during that time. The predominant age group in Henley Beach is 50-59 years. Households in Henley Beach are primarily couples with children and are likely to be repaying $1800 - $2399 per month on mortgage repayments. In general, people in Henley Beach work in a professional occupation.In 2021, 67.30% of the homes in Henley Beach were owner-occupied compared with 65.70% in 2016.
Henley Beach has 3,239 properties. Over the last 5 years, Houses in Henley Beach have seen a 71.90% increase in median value, while Units have seen a 92.28% increase. As at 31 May 2026:
- The median value for Houses in Henley Beach is $1,625,672 while the median value for Units is $818,371.
- Houses have a median rent of $845 while Units have a median rent of $550.
Suburb Insights for Henley Beach 5022
Market Insights
Henley Beach Trends for Houses
N/A
N/A
View TrendN/A
N/A
Henley Beach Trends for Units
N/A
N/A
View TrendN/A
N/A
Neighbourhood Insights
© Copyright 2026. RP Data Pty Ltd trading as Cotality (Cotality). All rights reserved. No reproduction, distribution, or transmission of the copyrighted materials is permitted. The information is deemed reliable but not guaranteed.
While Cotality uses commercially reasonable efforts to ensure the Cotality Data is current, Cotality does not warrant the accuracy, currency or completeness of the Cotality Data and to the full extent permitted by law excludes all loss or damage howsoever arising (including through negligence) in connection with the Cotality Data.
This product uses cookies and other similar technologies to improve and customise your browsing experience, to tailor content and adverts, and for analytics and metrics regarding visitor usage on this product and other media. We may share cookie and analytics information with third parties for the purposes of advertising. By continuing to use our website, you consent to cookies being used. View our Privacy Policy here.
X