
50 Thomas StreetCroydon SA 5008
Property Details for 50 Thomas St, Croydon
50 Thomas St, Croydon is a 3 bedroom, 2 bathroom House with 1 parking spaces and was built in 1913. The property has a land size of 463m2 and floor size of 176m2. While the property is not currently for sale or for rent, it was last sold in January 2026. There are other 3 bedroom House sold in Croydon in the last 12 months.
Last Listing description (February 2026)
This outstanding result was proudly achieved by Thomas Crawford and Cassandra Yeates of Crawford Doran Real Estate.
Their strategic approach, deep local knowledge, and commitment to exceptional service ensured a premium outcome for their vendors.
For further details on this sale, insights into the Croydon market, or to discuss your own property goals, Thomas and Cassandra warmly welcome your enquiry.
Disclaimer:
While we have made every effort to ensure the accuracy and completeness of the information presented in our marketing materials, we cannot guarantee the accuracy of information provided by our vendors. Accordingly, Crawford Doran Pty Ltd disclaims any statements, representations, or warranties regarding the accuracy of this information and assumes no legal liability in this regard. We encourage interested parties to conduct their own due diligence when considering the purchase of any property. Please note that all photographs, maps, and images are for marketing purposes only, and should be used only as a guide.
RLA 336264
Property History for 50 Thomas St, Croydon, SA 5008
- 22 Jan 2026Sold for $1,340,000
- 06 Nov 2025Listed for Sale Sold By Crawford Doran
- 11 Aug 2023Sold for $1,120,000

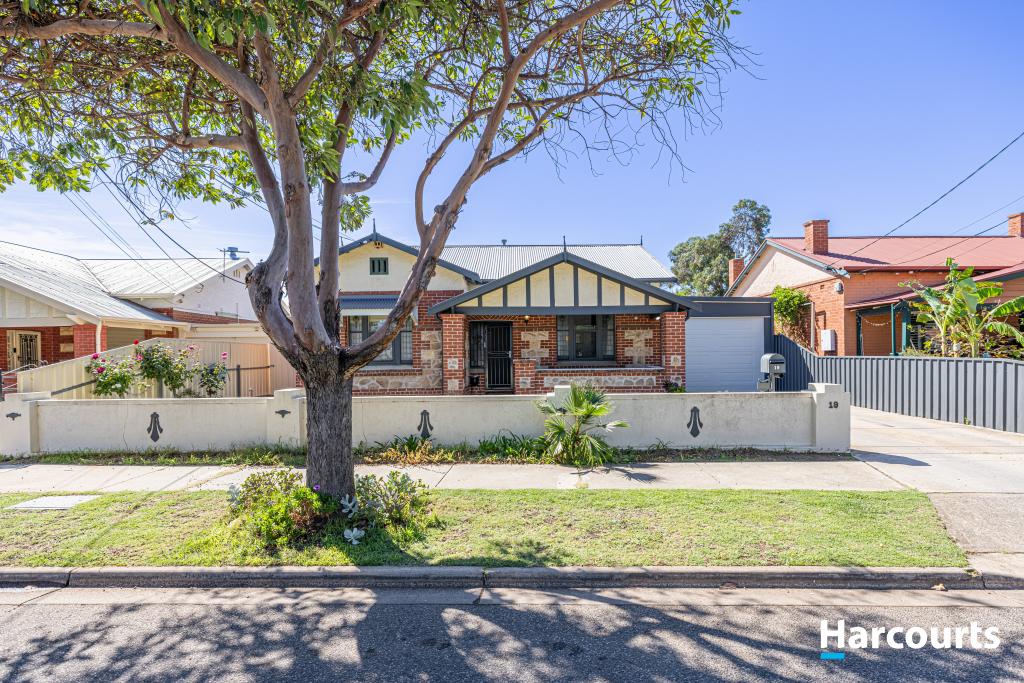
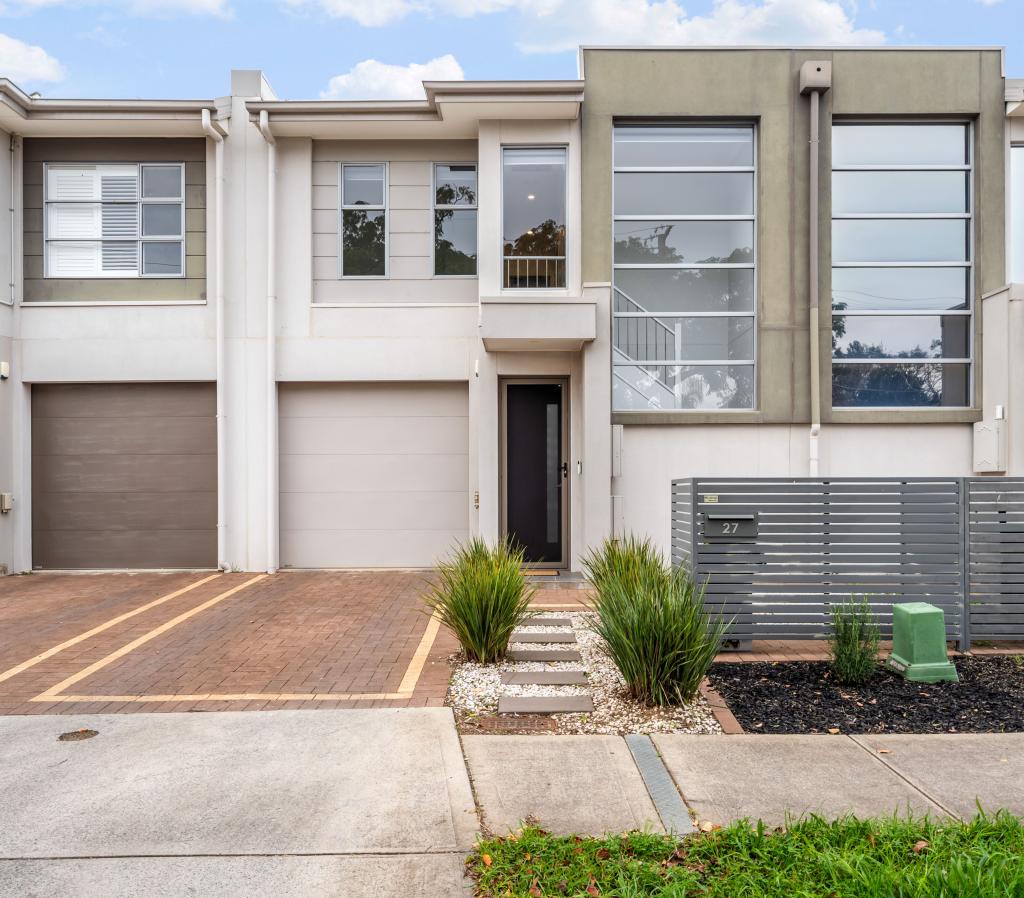
Recent sales nearby
See more recent sales nearbySimilar properties For Sale nearby
See more properties for sale nearby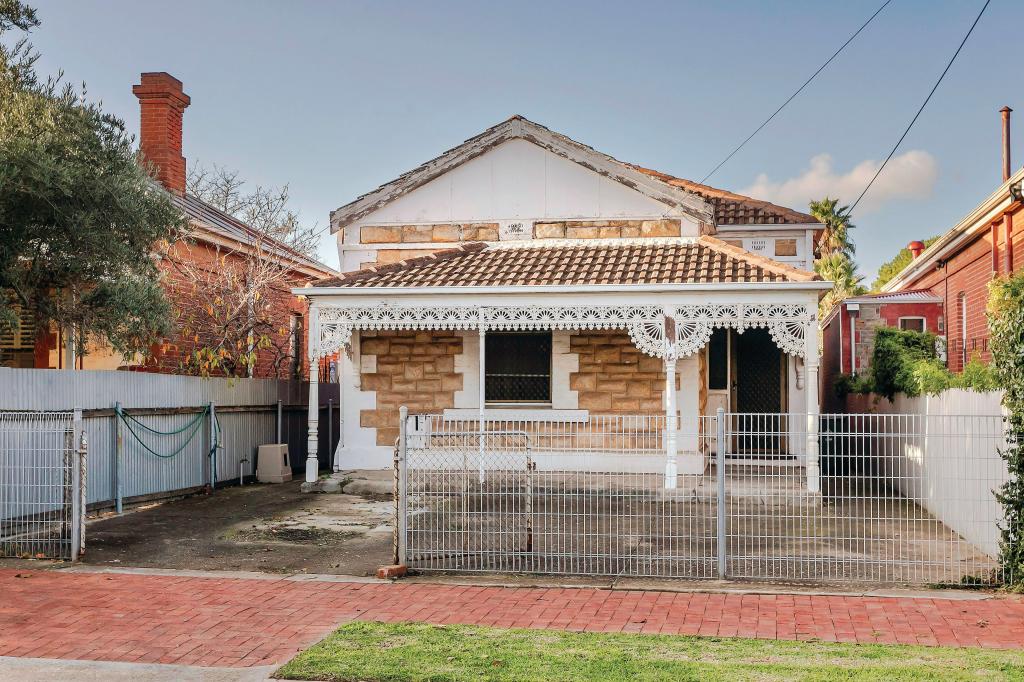 0
0
 0
0
 0
0Similar properties For Rent nearby
See more properties for rent nearby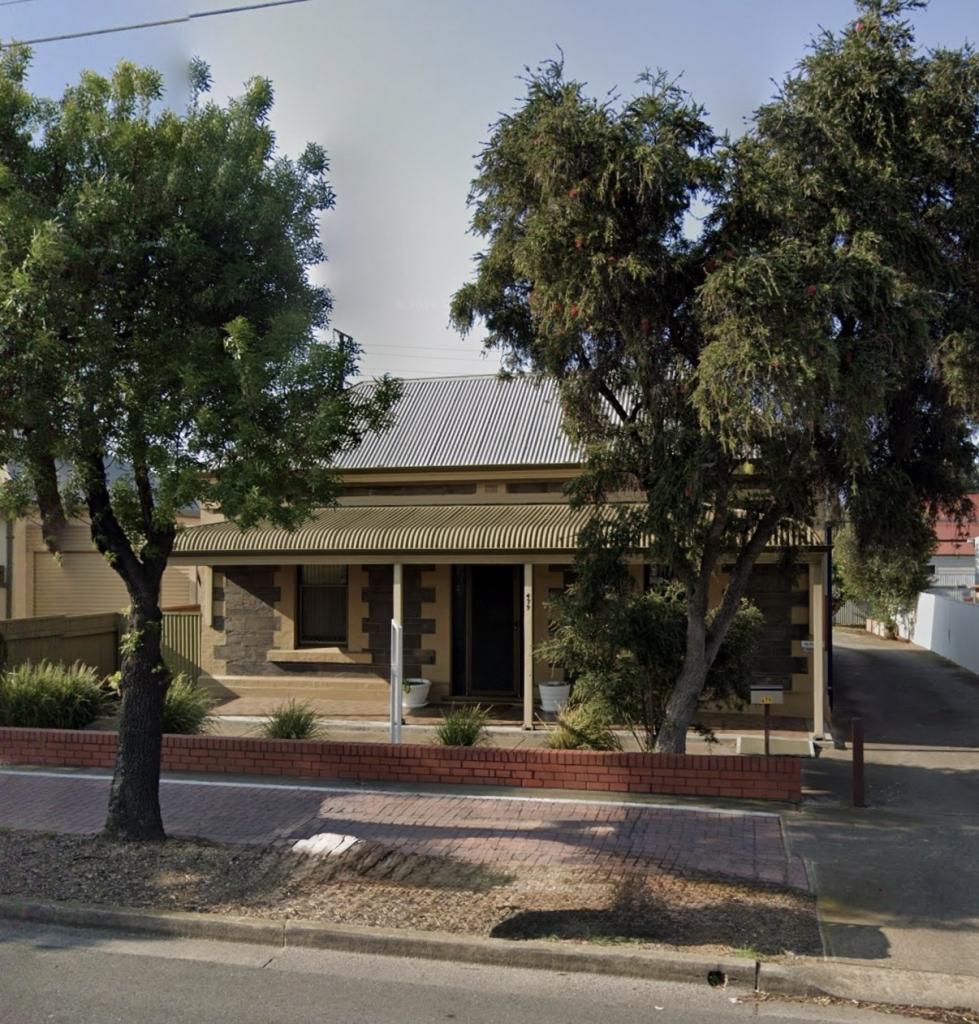 0
0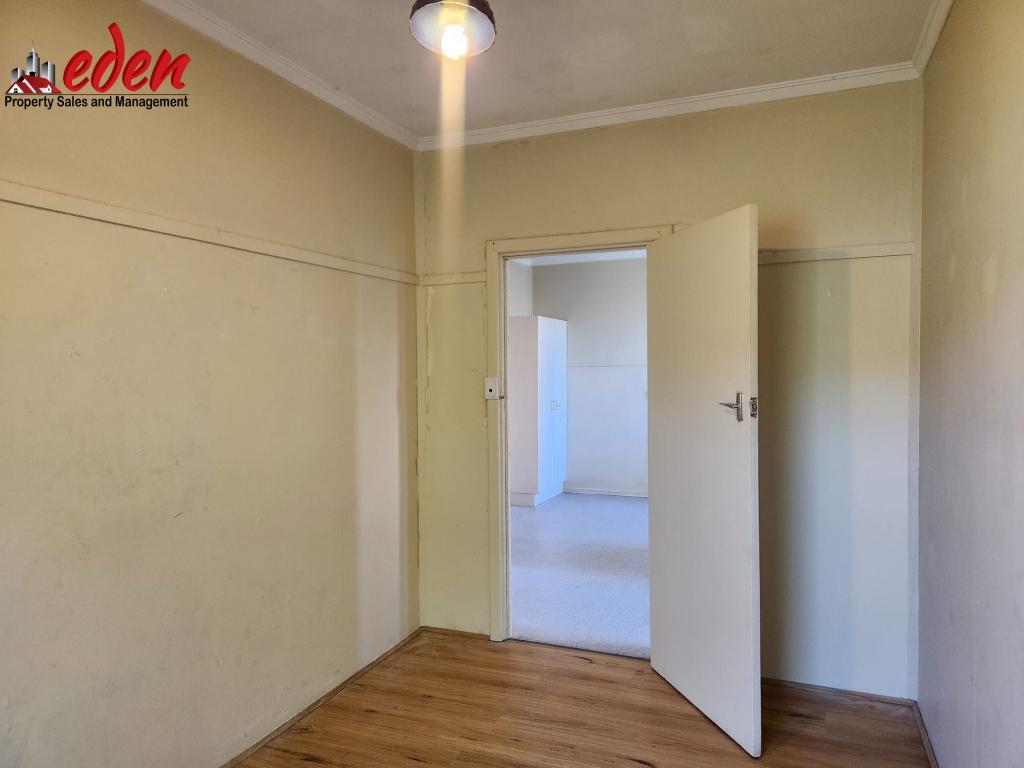 0
0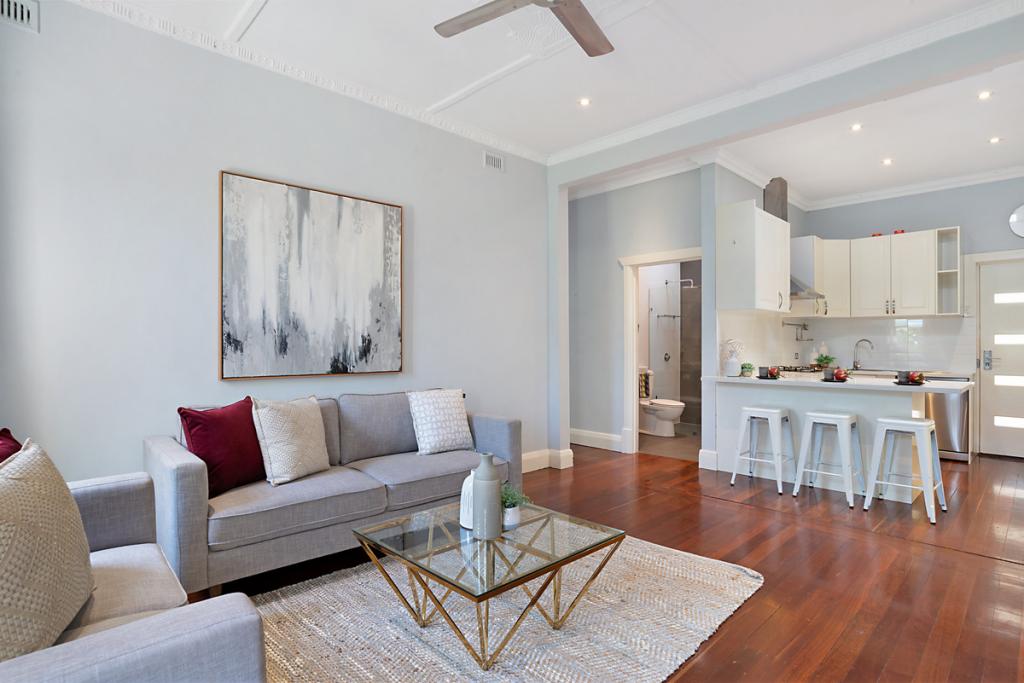 0
0
About Croydon 5008
The size of Croydon is approximately 0.6 square kilometres. There are 2 parks, covering nearly 0.2% of the total area. The population of Croydon in 2016 was 1238 people. By 2021 the population was 1220 showing a population decline of 1.4% in the area during that time. The predominant age group in Croydon is 50-59 years. Households in Croydon are primarily couples with children and are likely to be repaying $1800 - $2399 per month on mortgage repayments. In general, people in Croydon work in a professional occupation.In 2021, 71.80% of the homes in Croydon were owner-occupied compared with 70.80% in 2016.
Croydon has 638 properties. Over the last 5 years, Houses in Croydon have seen a 88.36% increase in median value, while Units have seen a 107.41% increase. As at 31 May 2026:
- The median value for Houses in Croydon is $1,278,910 while the median value for Units is $694,018.
- Houses have a median rent of $588 while Units have a median rent of $295.
Suburb Insights for Croydon 5008
Market Insights
Croydon Trends for Houses
N/A
N/A
View TrendN/A
N/A
Croydon Trends for Units
N/A
N/A
View TrendN/A
N/A
Neighbourhood Insights
© Copyright 2026. RP Data Pty Ltd trading as Cotality (Cotality). All rights reserved. No reproduction, distribution, or transmission of the copyrighted materials is permitted. The information is deemed reliable but not guaranteed.
While Cotality uses commercially reasonable efforts to ensure the Cotality Data is current, Cotality does not warrant the accuracy, currency or completeness of the Cotality Data and to the full extent permitted by law excludes all loss or damage howsoever arising (including through negligence) in connection with the Cotality Data.
This product uses cookies and other similar technologies to improve and customise your browsing experience, to tailor content and adverts, and for analytics and metrics regarding visitor usage on this product and other media. We may share cookie and analytics information with third parties for the purposes of advertising. By continuing to use our website, you consent to cookies being used. View our Privacy Policy here.
X