
52 Burnlea ParadeBlakeview SA 5114
Property Details for 52 Burnlea Pde, Blakeview
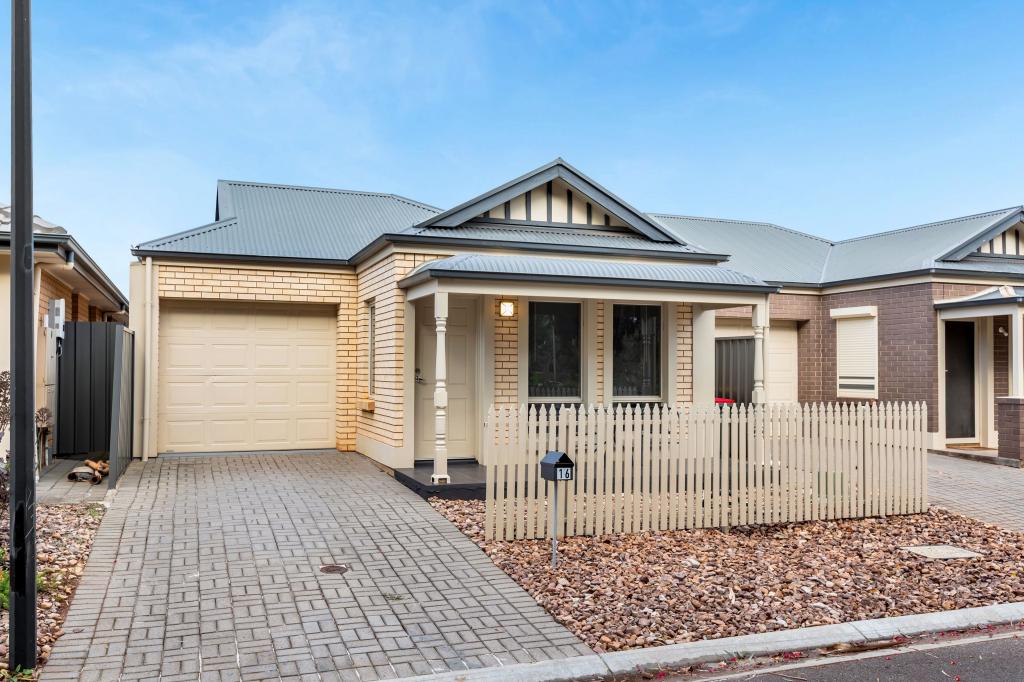
52 Burnlea Pde, Blakeview is a 2 bedroom, 1 bathroom House with 1 parking spaces and was built in 2019. The property has a land size of 132m2 and floor size of 70m2. While the property is not currently for sale or for rent, it was last sold in April 2024.
Last Listing description (October 2020)
Available: 9th October
Lease Term: 12 months
Pets: Negotiable
Features of the home include
- 2 good sized bedrooms both with built-in robes
- Open plan living, kitchen & dining area
- Bathroom & Laundry in one, with shower & toilet
- Ducted reverse cycle heating & cooling for year round comfort
- Back lawn area
- Access to single carport with automatic roller door from rear lane
Water Charges: Tenants to pay all water supply charge & all water usage
The Landlord cannot guarantee that the property has an active phone line or ADSL/NBN connections or in an internet availability area.
By registering, you will be INSTANTLY informed of any updates, changes.
RLA 200591
Property History for 52 Burnlea Pde, Blakeview, SA 5114
- 29 Apr 2024Sold for $385,000
- 15 May 2020Listed for Rent $260 / week
- 16 May 2019Sold for $85,000

Recent sales nearby
See more recent sales nearby
Similar properties For Sale nearby
See more properties for sale nearby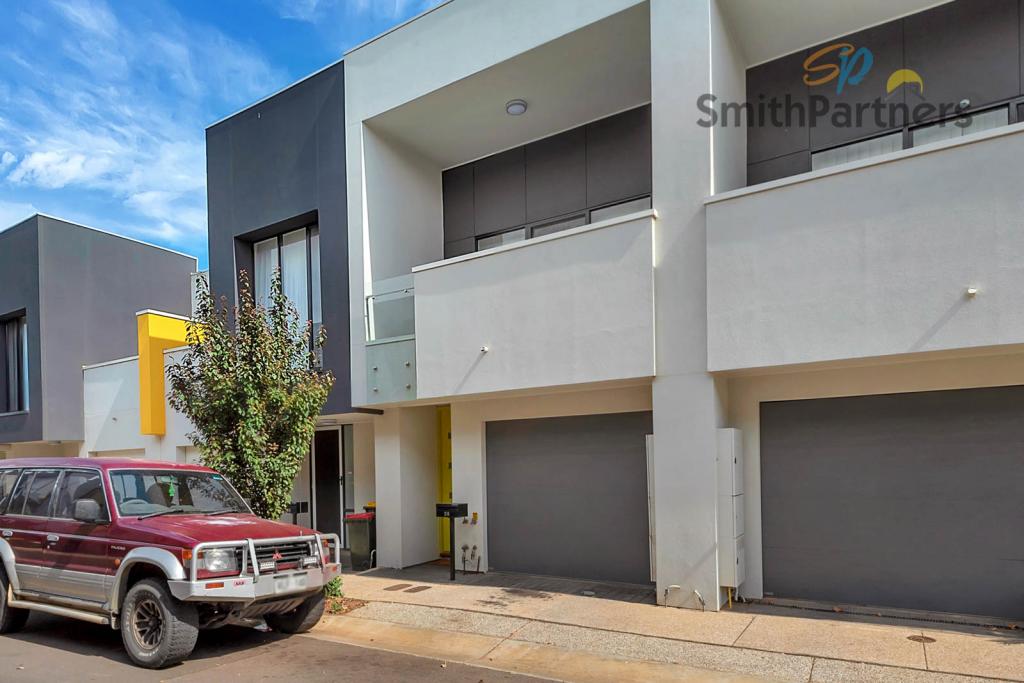 0
0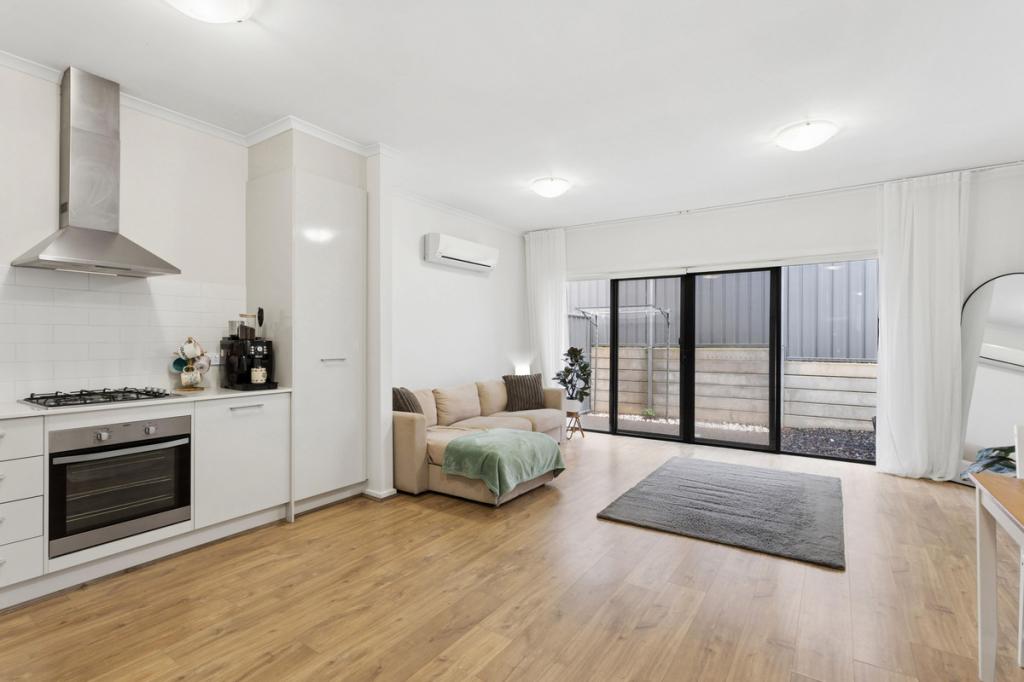 0
0
 0
0Similar properties For Rent nearby
See more properties for rent nearby 0
0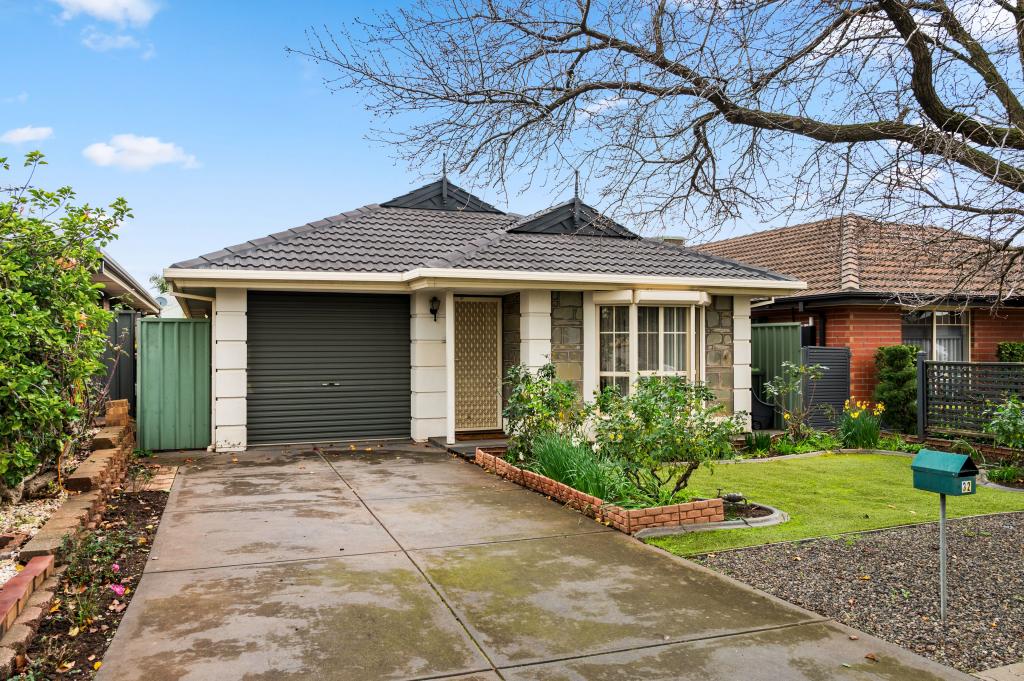 0
0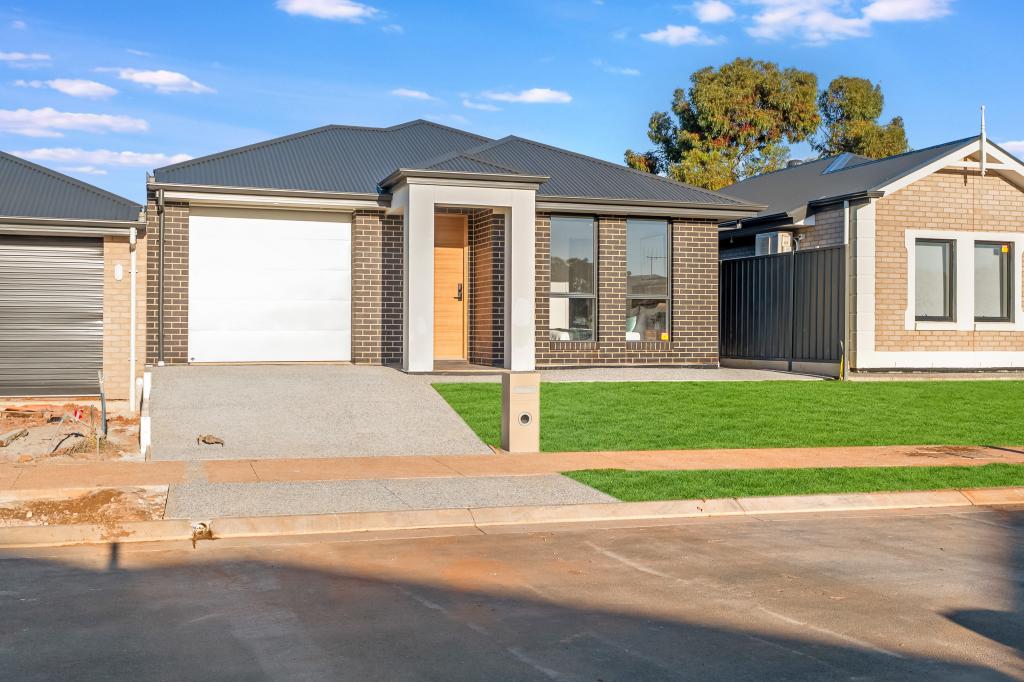 0
0About Blakeview 5114
The size of Blakeview is approximately 7.0 square kilometres. There are 32 parks, covering nearly 8.2% of the total area. The population of Blakeview in 2016 was 7229 people. By 2021 the population was 8979 showing a population growth of 24.2% in the area during that time. The predominant age group in Blakeview is 30-39 years. Households in Blakeview are primarily couples with children and are likely to be repaying $1400 - $1799 per month on mortgage repayments. In general, people in Blakeview work in a community and personal service occupation.In 2021, 66.90% of the homes in Blakeview were owner-occupied compared with 65.00% in 2016.
Blakeview has 4,450 properties. Over the last 5 years, Houses in Blakeview have seen a 98.50% increase in median value, while Units have seen a 154.62% increase. As at 30 June 2026:
- The median value for Houses in Blakeview is $762,836 while the median value for Units is $598,663.
- Houses have a median rent of $570 while Units have a median rent of $540.
Suburb Insights for Blakeview 5114
Market Insights
Blakeview Trends for Houses
N/A
N/A
View TrendN/A
N/A
Blakeview Trends for Units
N/A
N/A
View TrendN/A
N/A
Neighbourhood Insights
© Copyright 2026. RP Data Pty Ltd trading as Cotality (Cotality). All rights reserved. No reproduction, distribution, or transmission of the copyrighted materials is permitted. The information is deemed reliable but not guaranteed.
While Cotality uses commercially reasonable efforts to ensure the Cotality Data is current, Cotality does not warrant the accuracy, currency or completeness of the Cotality Data and to the full extent permitted by law excludes all loss or damage howsoever arising (including through negligence) in connection with the Cotality Data.
This product uses cookies and other similar technologies to improve and customise your browsing experience, to tailor content and adverts, and for analytics and metrics regarding visitor usage on this product and other media. We may share cookie and analytics information with third parties for the purposes of advertising. By continuing to use our website, you consent to cookies being used. View our Privacy Policy here.
X