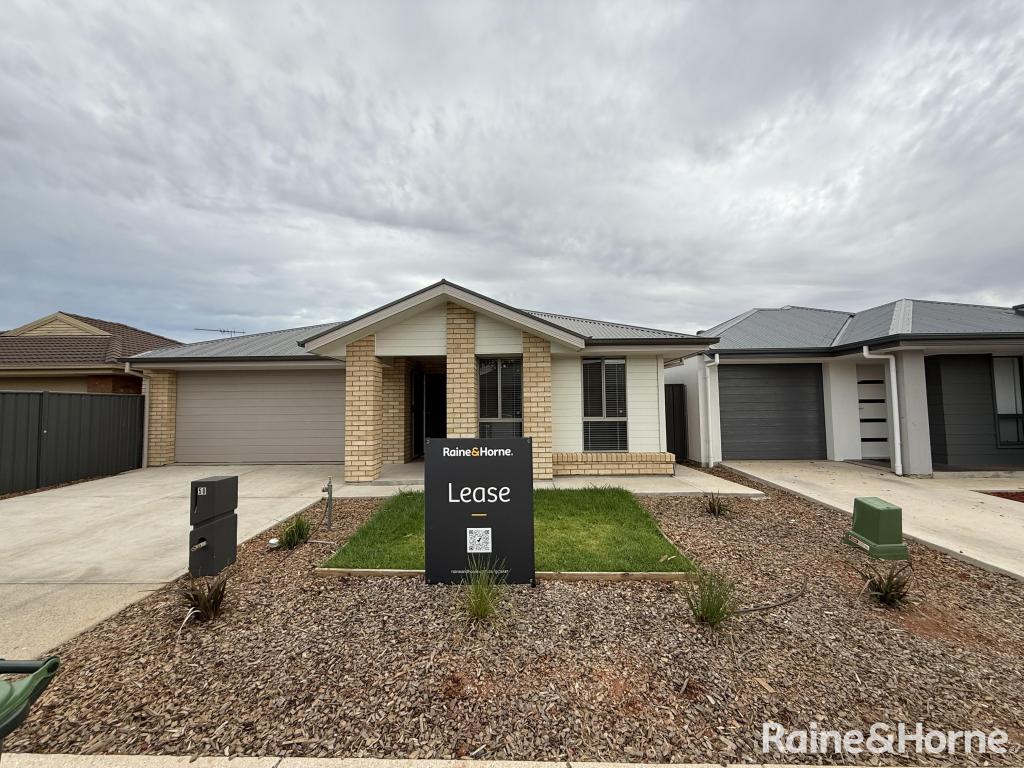
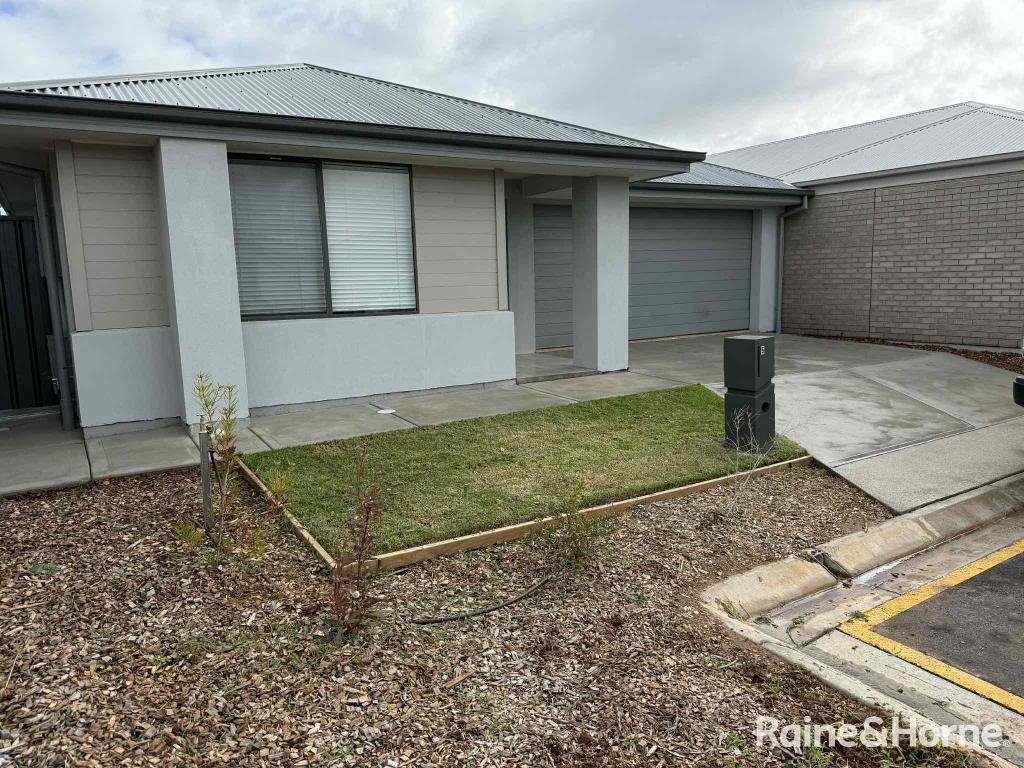
Andrews RoadAndrews Farm SA 5114

Thinking about insurance?
Get estimated rebuild costs for this property with Sum SureProperty Details for Lot 3 Andrews Rd, Andrews Farm
Lot 3 Andrews Rd, Andrews Farm is a 4 bedroom, bathroom House and was built in 1960. The property has a land size of 2023m2 and floor size of 136m2. While the property is not currently for sale or for rent, it was last sold in February 2010.
Property History for Lot 3 Andrews Rd, Andrews Farm, SA 5114
- 24 Feb 2010Sold for $760,000
- 31 May 1999Sold for $100,000
Recent sales nearby
See more recent sales nearbySimilar properties For Sale nearby
See more properties for sale nearby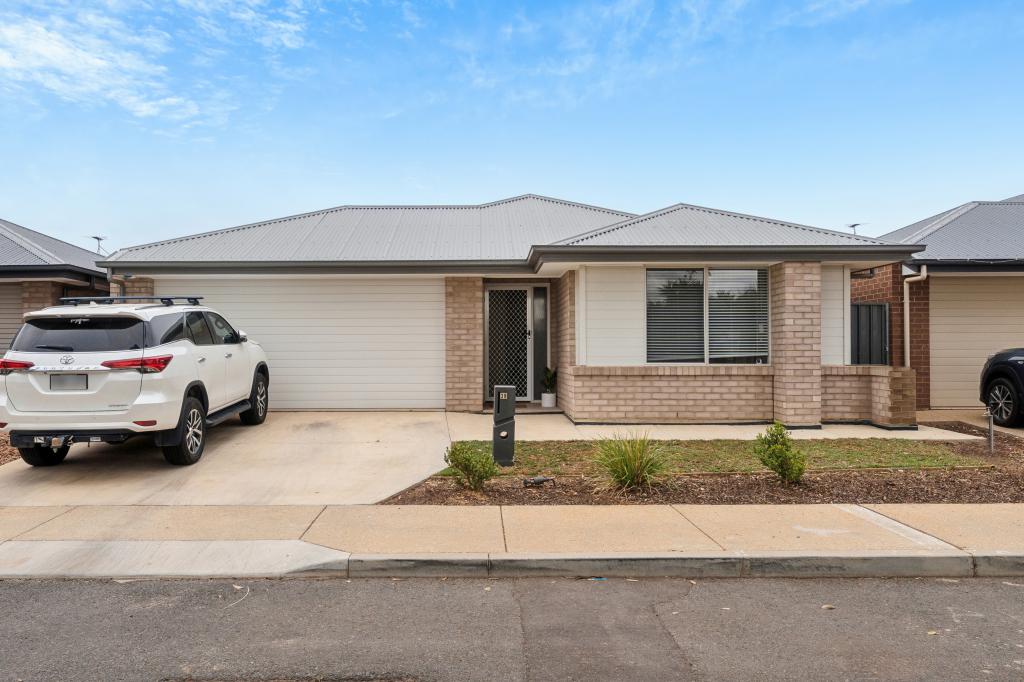

Similar properties For Rent nearby
See more properties for rent nearby
About Andrews Farm 5114
The size of Andrews Farm is approximately 4.0 square kilometres. It has 24 parks covering nearly 9.0% of total area. The population of Andrews Farm in 2016 was 8043 people. By 2021 the population was 8699 showing a population growth of 8.2% in the area during that time. The predominant age group in Andrews Farm is 0-9 years. Households in Andrews Farm are primarily couples with children and are likely to be repaying $1000 - $1399 per month on mortgage repayments. In general, people in Andrews Farm work in a community and personal service occupation.In 2021, 58.50% of the homes in Andrews Farm were owner-occupied compared with 55.80% in 2016..
Andrews Farm has 4,420 properties. Over the last 5 years, Houses in Andrews Farm have seen a 149.27% increase in median value, while Units have seen a 124.15% increase. As at 30 June 2025:
- The median value for Houses in Andrews Farm is $633,241 while the median value for Units is $481,633.
- Houses have a median rent of $550 while Units have a median rent of $455.
What's around Lot 3 Andrews Rd, Andrews Farm
Lot 3 Andrews Rd, Andrews Farm is in the school catchment zone for John Hartley School (B-7) and Mark Oliphant College (B-12).


Suburb Insights for Andrews Farm 5114
Market Insights
Andrews Farm Trends for Houses
$633k
17.45%
View Trend$550/W
4.69%
Andrews Farm Trends for Units
$482k
15.16%
View Trend$455/W
4.76%
Neighbourhood Insights
Age
Population 8,699
0-9
19%
10-19
16%
20-29
17%
30-39
18%
40-49
11%
50-59
9%
60-69
6%
70-79
3%
80-89
1%
Household Structure
Occupancy
© Copyright 2025 RP Data Pty Ltd trading as CoreLogic Asia Pacific (CoreLogic). All rights reserved.