
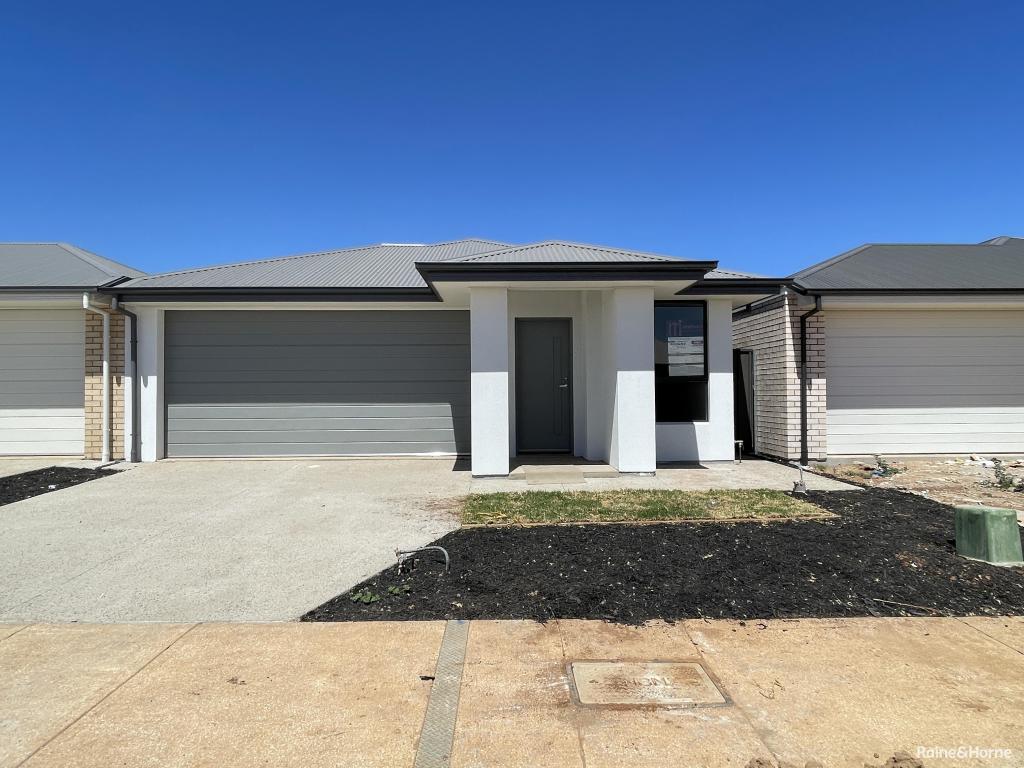
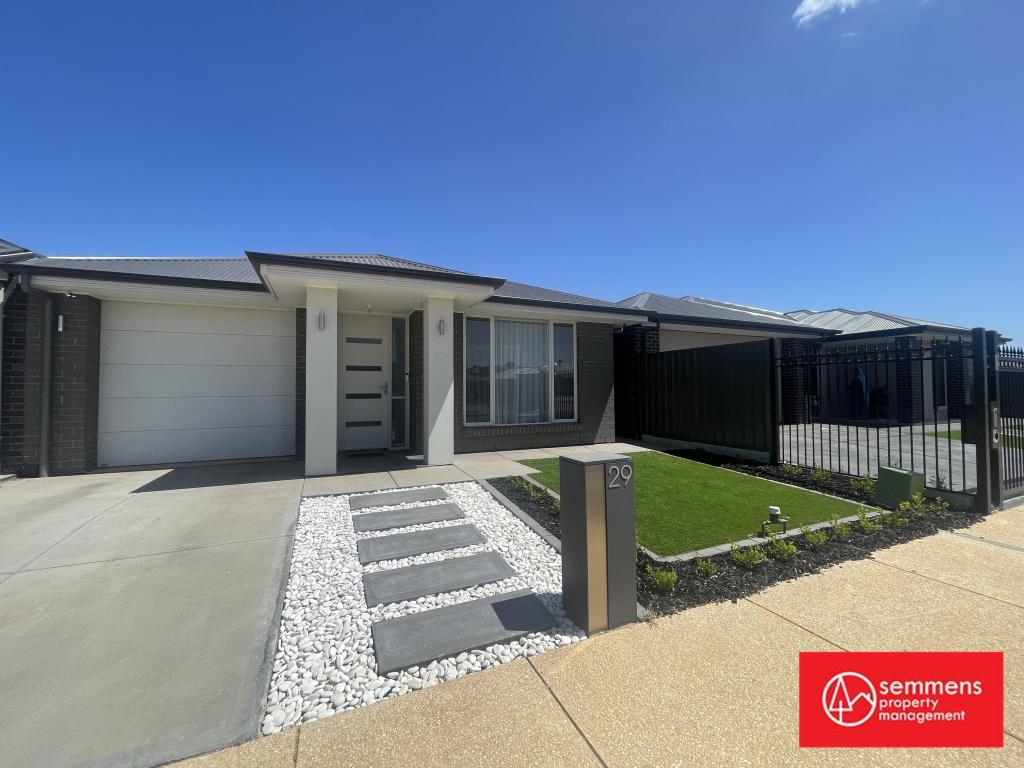
1 Flannery CrescentAndrews Farm SA 5114

Thinking about insurance?
Get estimated rebuild costs for this property with Sum SureProperty Details for 1 Flannery Cres, Andrews Farm
1 Flannery Cres, Andrews Farm is a 3 bedroom, 2 bathroom House with 2 parking spaces and was built in 2009. The property has a land size of 420m2 and floor size of 163m2. While the property is not currently for sale or for rent, it was last sold in December 2010.
Property History for 1 Flannery Cres, Andrews Farm, SA 5114
- 16 Dec 2010Sold for $320,000
- 18 Jun 2008Sold for $82,000

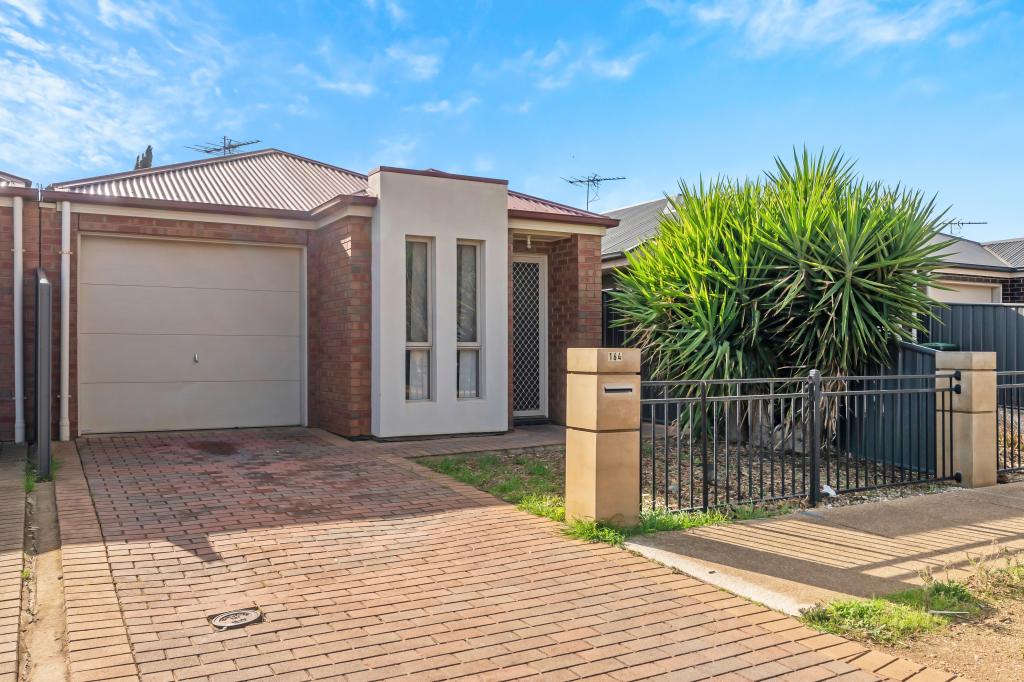
Recent sales nearby
See more recent sales nearbySimilar properties For Sale nearby
See more properties for sale nearby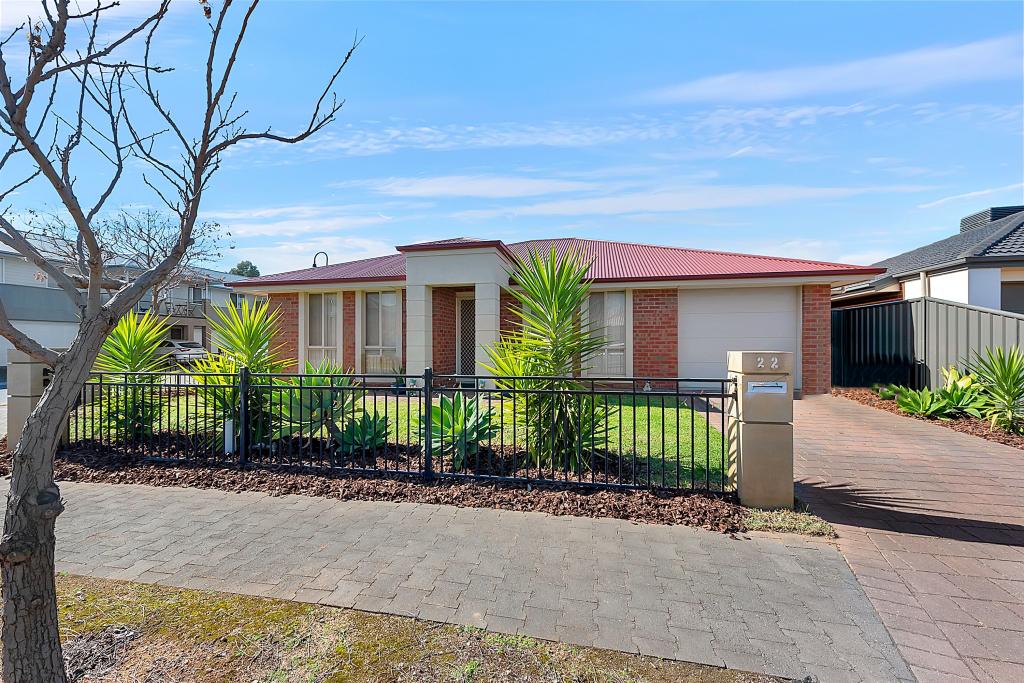


Similar properties For Rent nearby
See more properties for rent nearby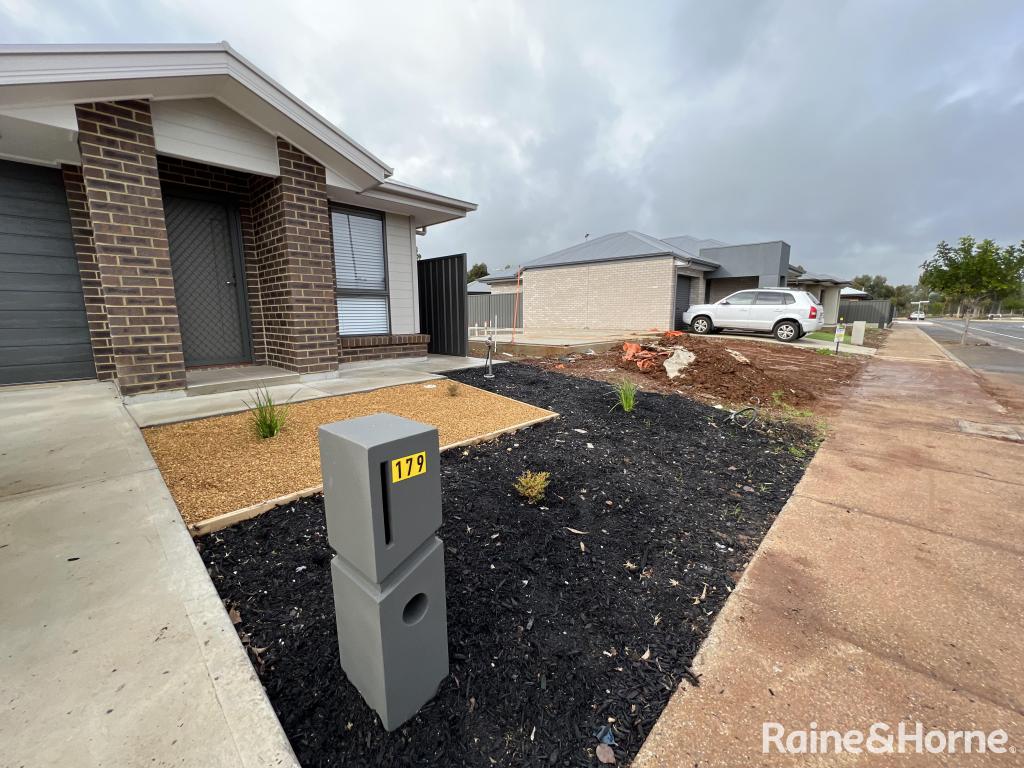
About Andrews Farm 5114
The size of Andrews Farm is approximately 4.0 square kilometres. It has 24 parks covering nearly 9.0% of total area. The population of Andrews Farm in 2016 was 8043 people. By 2021 the population was 8699 showing a population growth of 8.2% in the area during that time. The predominant age group in Andrews Farm is 0-9 years. Households in Andrews Farm are primarily couples with children and are likely to be repaying $1000 - $1399 per month on mortgage repayments. In general, people in Andrews Farm work in a community and personal service occupation.In 2021, 58.50% of the homes in Andrews Farm were owner-occupied compared with 55.80% in 2016..
Andrews Farm has 4,431 properties. Over the last 5 years, Houses in Andrews Farm have seen a 150.05% increase in median value, while Units have seen a 144.45% increase. As at 31 July 2025:
- The median value for Houses in Andrews Farm is $637,815 while the median value for Units is $506,610.
- Houses have a median rent of $550 while Units have a median rent of $475.
What's around 1 Flannery Cres, Andrews Farm
1 Flannery Cres, Andrews Farm is in the school catchment zone for John Hartley School (B-7) and Mark Oliphant College (B-12).


Suburb Insights for Andrews Farm 5114
Market Insights
Andrews Farm Trends for Houses
$638k
14.93%
View Trend$550/W
4.67%
Andrews Farm Trends for Units
$507k
17.06%
View Trend$475/W
4.71%
Neighbourhood Insights
Age
Population 8,699
0-9
19%
10-19
16%
20-29
17%
30-39
18%
40-49
11%
50-59
9%
60-69
6%
70-79
3%
80-89
1%
Household Structure
Occupancy
© Copyright 2025. RP Data Pty Ltd trading as Cotality (Cotality). All rights reserved. No reproduction, distribution, or transmission of the copyrighted materials is permitted. The information is deemed reliable but not guaranteed.
While Cotality uses commercially reasonable efforts to ensure the Cotality Data is current, Cotality does not warrant the accuracy, currency or completeness of the Cotality Data and to the full extent permitted by law excludes all loss or damage howsoever arising (including through negligence) in connection with the Cotality Data.
This publication contains data and statistics provided by the Australian Bureau of Statistics (ABS Data). ©2025 Copyright in this information belongs to the Australian Bureau of Statistics (ABS). The ABS provides no warranty that the ABS Data is free from error, complete or suitable for any particular purpose.
This product uses cookies and other similar technologies to improve and customise your browsing experience, to tailor content and adverts, and for analytics and metrics regarding visitor usage on this product and other media. We may share cookie and analytics information with third parties for the purposes of advertising. By continuing to use our website, you consent to cookies being used. View our Privacy Policy here.
X