
17/16 Tallon StreetUpper Coomera QLD 4209
Property Details for 17/16 Tallon St, Upper Coomera
17/16 Tallon St, Upper Coomera is a 3 bedroom, 2 bathroom Townhouse with 2 parking spaces and was built in 2019. While the property is not currently for sale or for rent, it was last sold in December 2025. There are other 3 bedroom Townhouse sold in Upper Coomera in the last 12 months.
Last Listing description (December 2025)
Proudly presenting 17/16 Tallon Street, Upper Coomera, a stylish three-bedroom townhouse situated within the small, well-maintained 'The Stanhope Residences' complex. Close to shops, parks and schools, enjoy the ease of convenience being close to all the amenity Upper Coomera has to offer, plus the peace and quiet this home affords with no rear neighbours!
Built in 2020 and presented for sale with all the bells and whistles (including an epic man-cave!), this property is in near-new condition and has been optimised by the owners for easy living both inside and out.
- Spacious master bedroom with air conditioning, ceiling fan, walk through wardrobe, and modern ensuite complete with double vanity
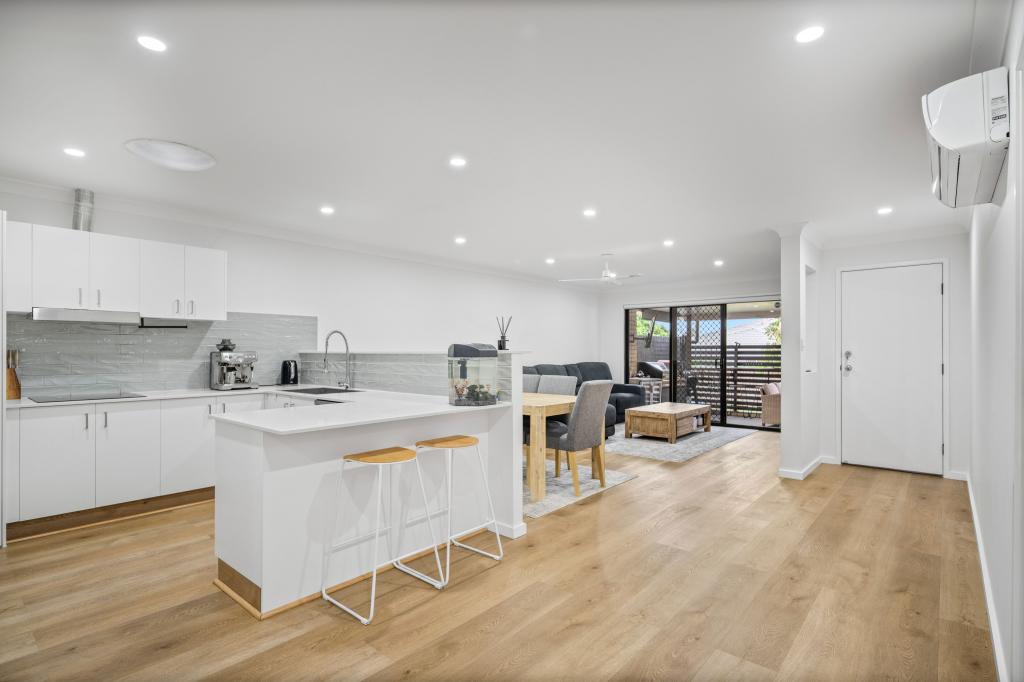
- Immaculate kitchen complete with microwave nook, loads of preparation space and modern appliances including dishwasher
- Naturally light, airconditioned open plan living and dining area
- East-facing balcony with a gorgeous view and blinds for added privacy
- Modern main bathroom with shower and separate toilet
- Tiled outdoor seating area to the rear with blinds for additional shade in the afternoon
- Fully-fenced backyard with synthetic turf and hanging planters
- Double lock up garage with sensor light
- Epic man-cave off the garage with workbench and loads of storage space
- European laundry
- 5kw solar system
- Low body corporate approx. $74 per week
Whether you are looking for a low maintenance, set and forget investment that is poised for future growth or a fantastic family home in an ideal family-friendly area, this property is sure to impress. To ensure that you do not miss your chance to secure this home, call Summer Glassop to organise an inspection today!
Property History for 17/16 Tallon St, Upper Coomera, QLD 4209
- 25 Nov 2025Sold for $915,000
- 17 Nov 2025Listed for Sale Offers over $860,000
- 31 Oct 2019Sold for $439,900

Recent sales nearby
See more recent sales nearbySimilar properties For Sale nearby
See more properties for sale nearby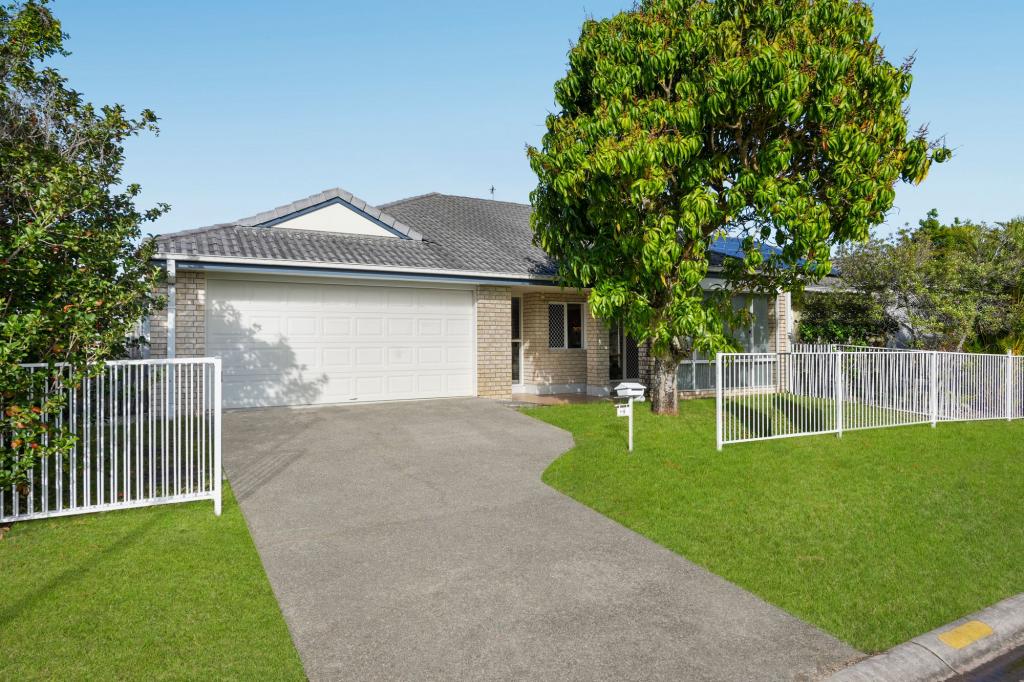 0
0

 0
0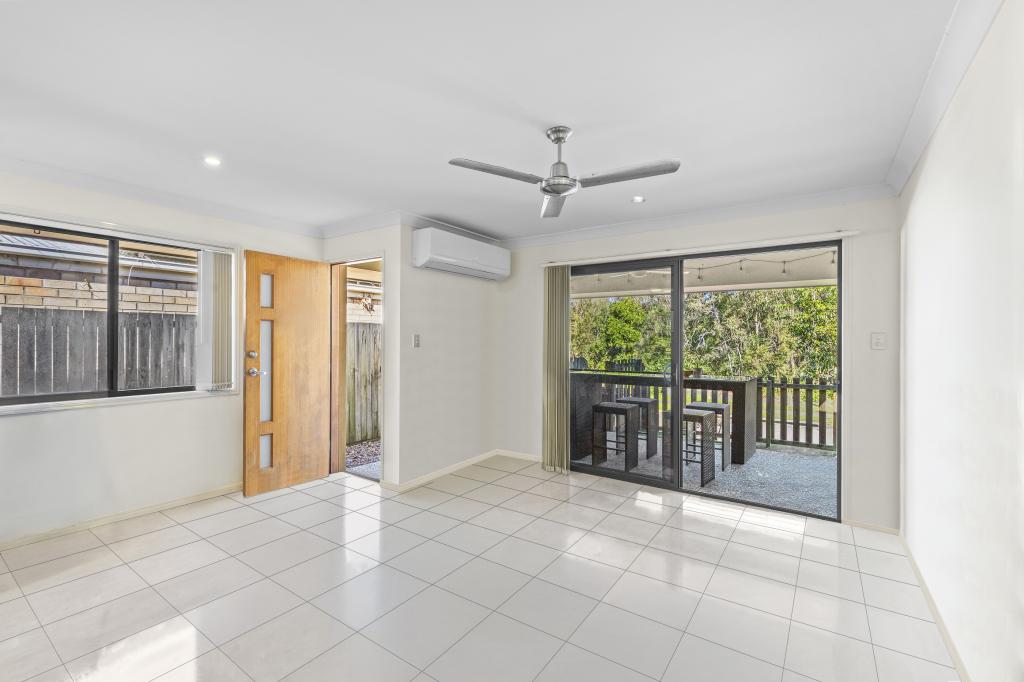 0
0Similar properties For Rent nearby
See more properties for rent nearby 0
0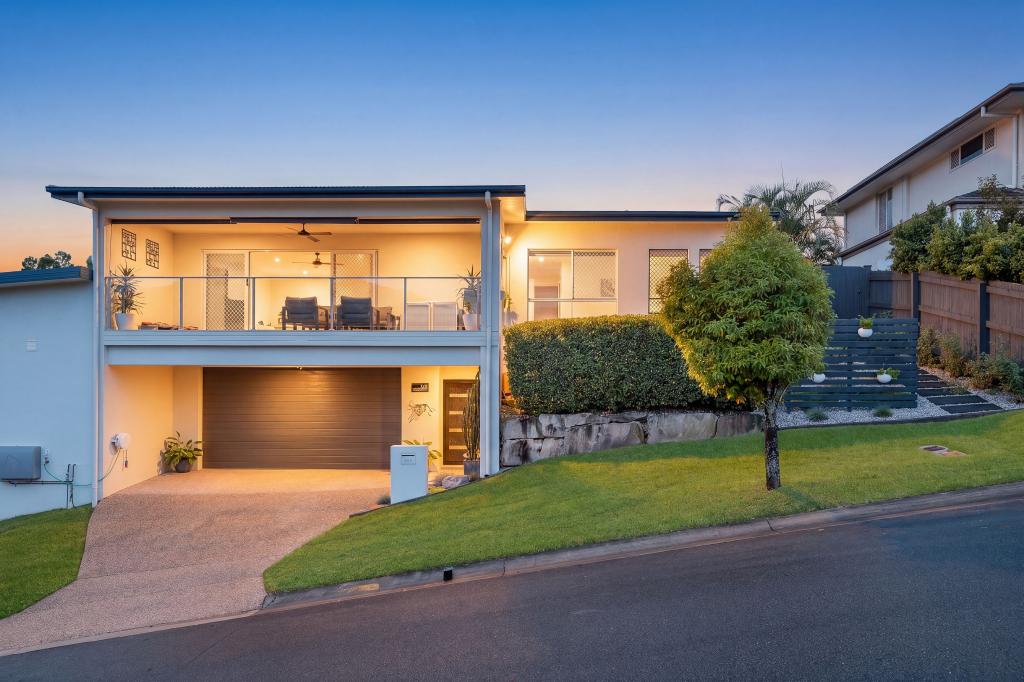 0
0About Upper Coomera 4209
The size of Upper Coomera is approximately 23.8 square kilometres. There are 54 parks, covering nearly 9.6% of the total area. The population of Upper Coomera in 2016 was 25276 people. By 2021 the population was 27180 showing a population growth of 7.5% in the area during that time. The predominant age group in Upper Coomera is 10-19 years. Households in Upper Coomera are primarily couples with children and are likely to be repaying $1800 - $2399 per month on mortgage repayments. In general, people in Upper Coomera work in a trades occupation.In 2021, 63.80% of the homes in Upper Coomera were owner-occupied compared with 53.30% in 2016.
Upper Coomera has 10,348 properties. Over the last 5 years, Houses in Upper Coomera have seen a 97.45% increase in median value, while Units have seen a 141.78% increase. As at 31 May 2026:
- The median value for Houses in Upper Coomera is $1,224,488 while the median value for Units is $922,732.
- Houses have a median rent of $850 while Units have a median rent of $750.
Suburb Insights for Upper Coomera 4209
Market Insights
Upper Coomera Trends for Houses
N/A
N/A
View TrendN/A
N/A
Upper Coomera Trends for Units
N/A
N/A
View TrendN/A
N/A
Neighbourhood Insights
© Copyright 2026. RP Data Pty Ltd trading as Cotality (Cotality). All rights reserved. No reproduction, distribution, or transmission of the copyrighted materials is permitted. The information is deemed reliable but not guaranteed.
While Cotality uses commercially reasonable efforts to ensure the Cotality Data is current, Cotality does not warrant the accuracy, currency or completeness of the Cotality Data and to the full extent permitted by law excludes all loss or damage howsoever arising (including through negligence) in connection with the Cotality Data.
This product uses cookies and other similar technologies to improve and customise your browsing experience, to tailor content and adverts, and for analytics and metrics regarding visitor usage on this product and other media. We may share cookie and analytics information with third parties for the purposes of advertising. By continuing to use our website, you consent to cookies being used. View our Privacy Policy here.
X