
19/35 Morrow StreetTaringa QLD 4068
Property Details for 19/35 Morrow St, Taringa
19/35 Morrow St, Taringa is a 2 bedroom, 2 bathroom Unit with 1 parking spaces and was built in 2003. The property has a land size of 98m2 and floor size of 78m2. While the property is not currently for sale or for rent, it was last sold in August 2015.
Last Listing description (September 2015)
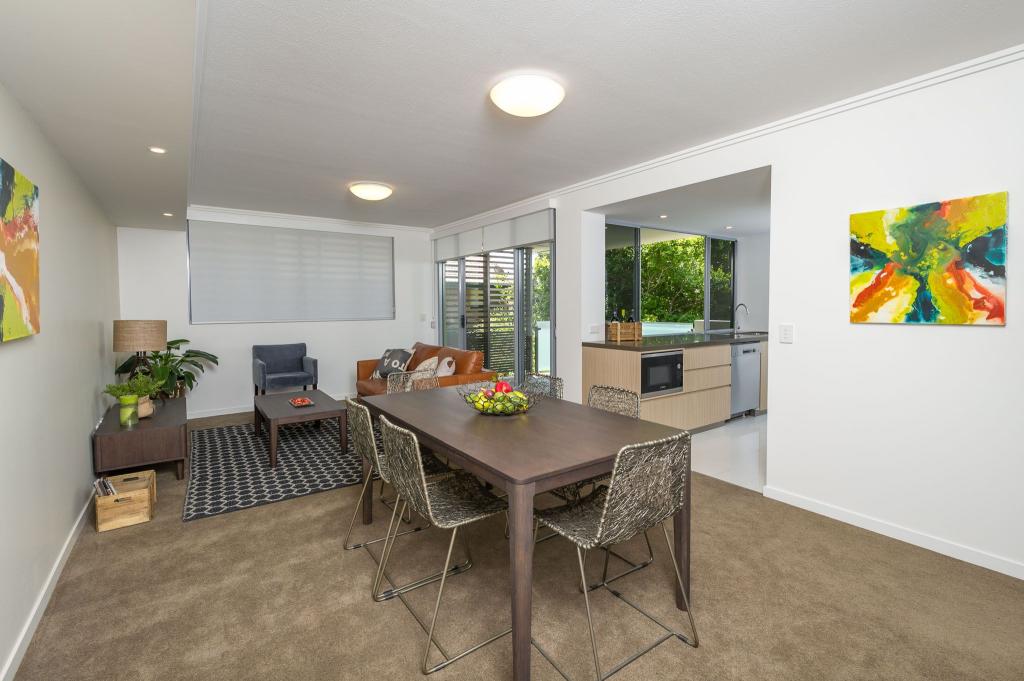
Here is one of the best returning 2 Bed 2 Bath apartments in the Western suburbs, for an affordable price. Located within the incredibly popular 'Altitude Apartments' which features great facilities and onsite management, this spacious unit comes fully furnished and rents for $490 / week.
Equipped with hardwearing finishings, this is a low maintenance property that is bound to keep both you and your tenants extremely happy for many years to come. Other important features include city views from the balcony, and both bedrooms are ensuited allowing occupants great privacy and separation.
At this attractive price it won't last long, so don't hesitate and enquire today.
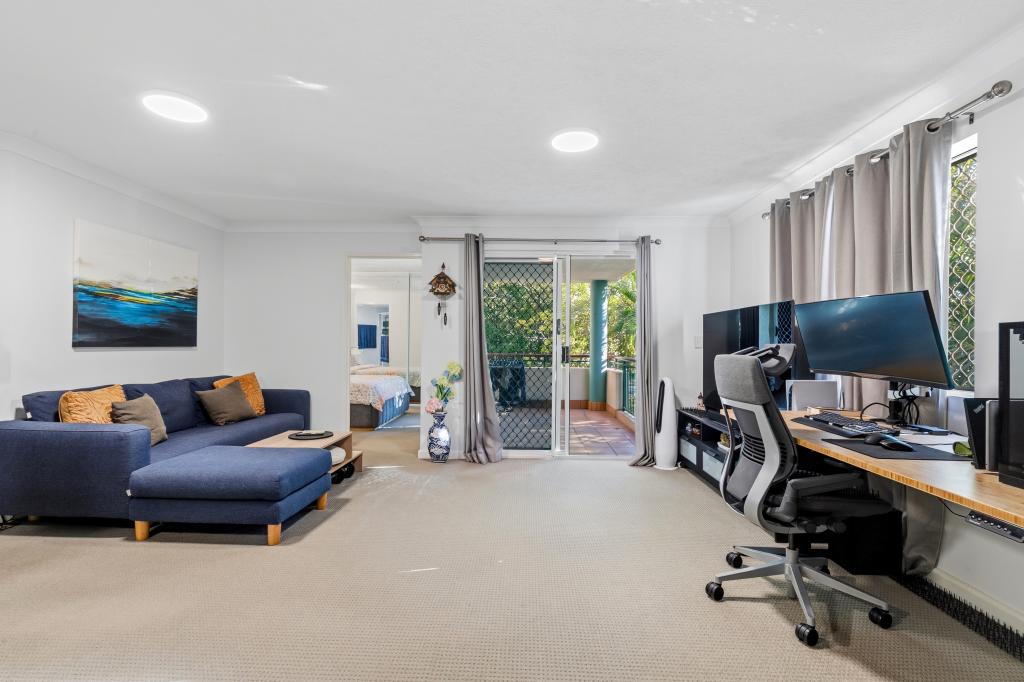
* 2 Bedrooms with Built in robes and study desks
* 2 Ensuite bathrooms allowing for great privacy
* 1 Secure covered car space
* Laundry included
* Sold fully furnished
* Returning $490pw rent (current lease until 14/02/16)
* Generous balcony with city views
* Air conditioned
* Secure intercom entry and lift access
* 2 Pools, 2 BBQ areas, gym & games room all in complex
* Full time on-site manager
* Located in the heart of Taringa's public transport and shopping hub.
Brisbane City Council rates: $1221.88 per annum
Body Corporate fees: $4,840 per annum
Year built: 2002
Property History for 19/35 Morrow St, Taringa, QLD 4068
- 06 Oct 2015Listed for Sale Not Disclosed
- 11 Aug 2015Sold for $372,000
- 23 Jul 2015Listed for Sale Offers over $360,000

Recent sales nearby
See more recent sales nearbySimilar properties For Sale nearby
See more properties for sale nearby
 0
0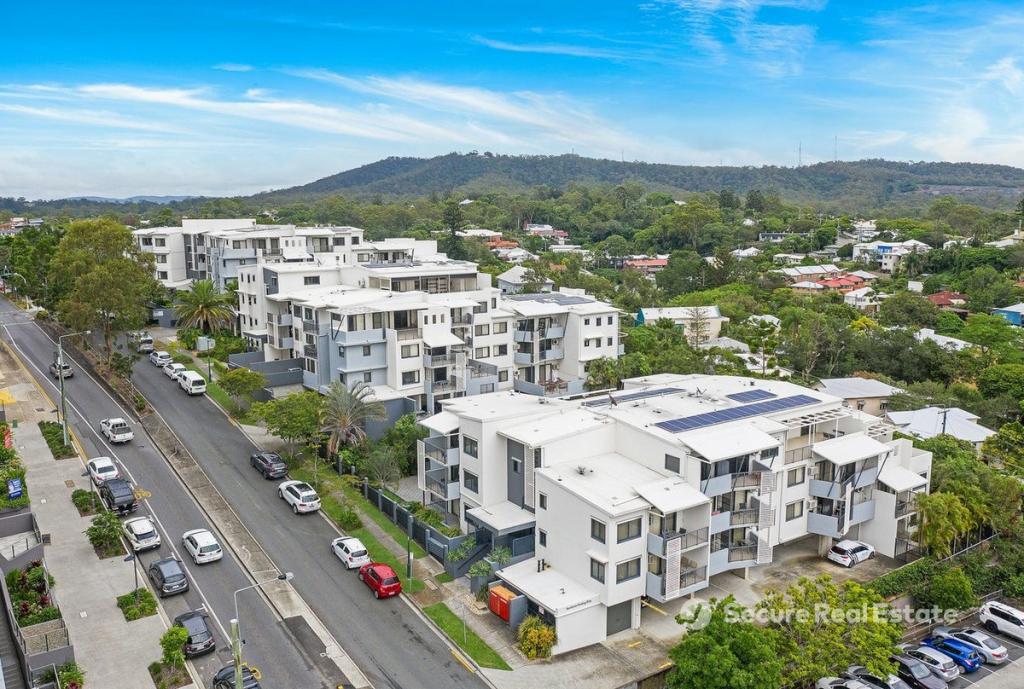 0
0
 0
0Similar properties For Rent nearby
See more properties for rent nearby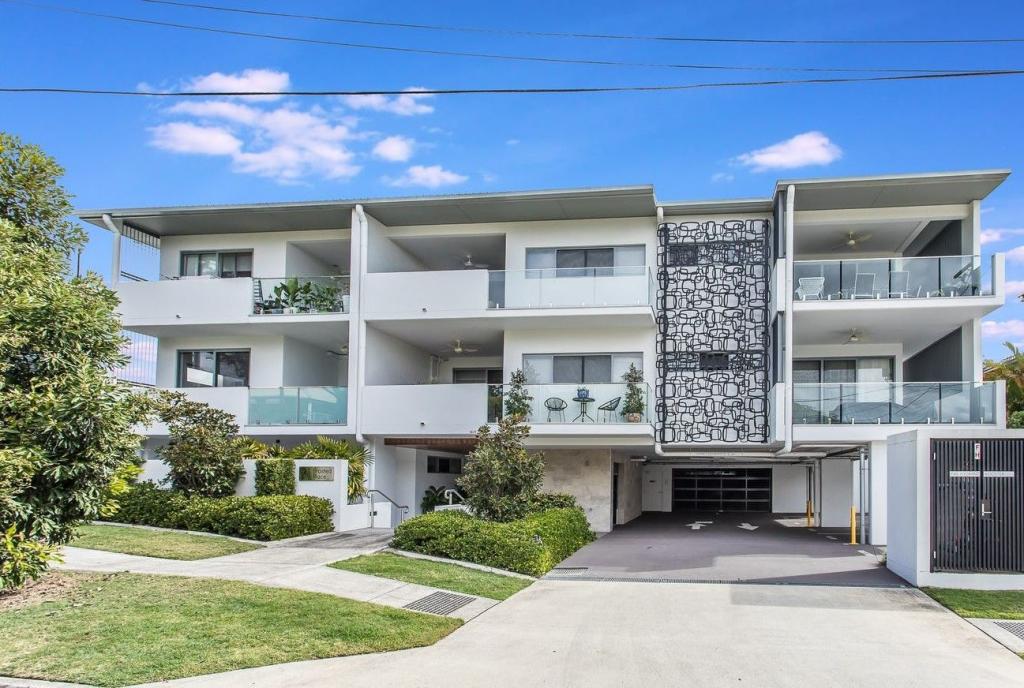 0
0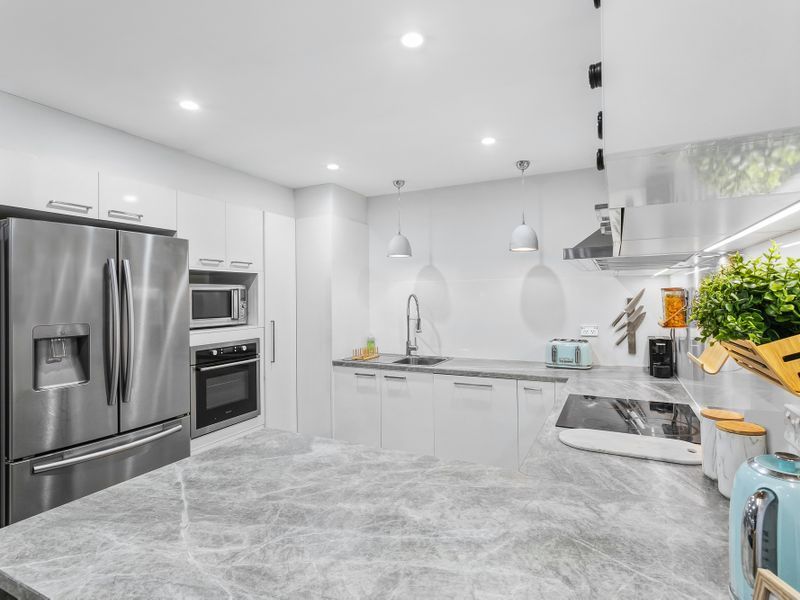 0
0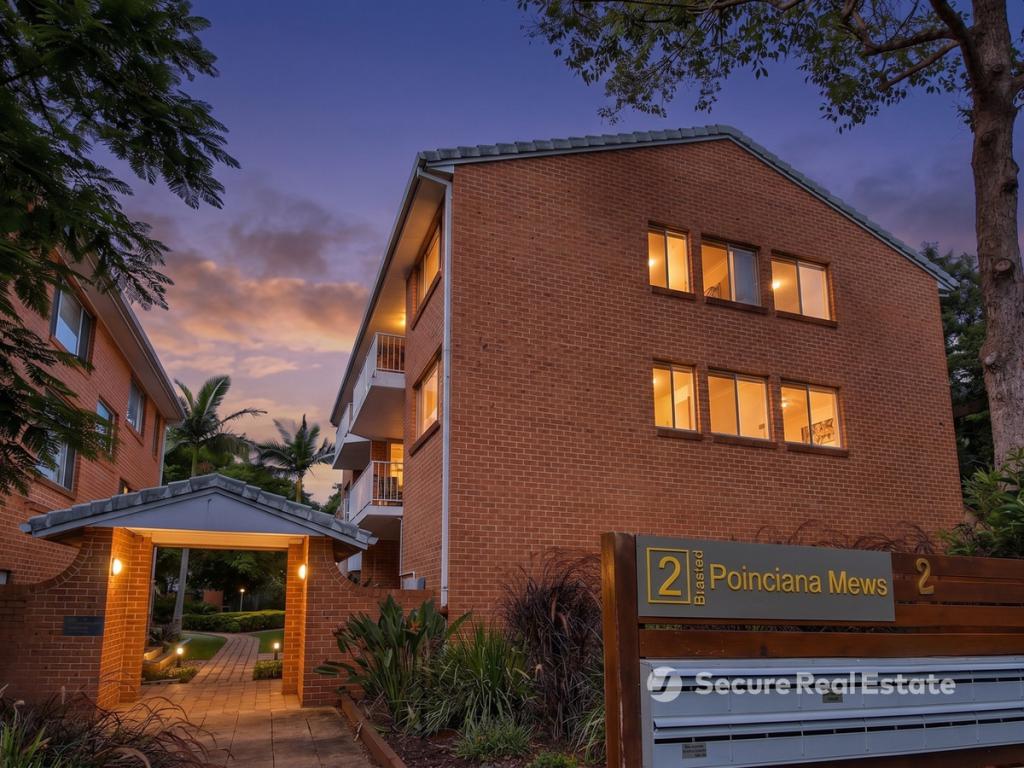 0
0About Taringa 4068
The size of Taringa is approximately 2.1 square kilometres. There are 10 parks, covering nearly 9.1% of the total area. The population of Taringa in 2016 was 8376 people. By 2021 the population was 8732 showing a population growth of 4.2% in the area during that time. The predominant age group in Taringa is 20-29 years. Households in Taringa are primarily childless couples and are likely to be repaying $1800 - $2399 per month on mortgage repayments. In general, people in Taringa work in a professional occupation.In 2021, 48.70% of the homes in Taringa were owner-occupied compared with 43.60% in 2016.
Taringa has 5,265 properties. Over the last 5 years, Houses in Taringa have seen a 56.27% increase in median value, while Units have seen a 102.65% increase. As at 30 June 2026:
- The median value for Houses in Taringa is $1,981,164 while the median value for Units is $922,253.
- Houses have a median rent of $780 while Units have a median rent of $650.
Suburb Insights for Taringa 4068
Market Insights
Taringa Trends for Houses
N/A
N/A
View TrendN/A
N/A
Taringa Trends for Units
N/A
N/A
View TrendN/A
N/A
Neighbourhood Insights
© Copyright 2026. RP Data Pty Ltd trading as Cotality (Cotality). All rights reserved. No reproduction, distribution, or transmission of the copyrighted materials is permitted. The information is deemed reliable but not guaranteed.
While Cotality uses commercially reasonable efforts to ensure the Cotality Data is current, Cotality does not warrant the accuracy, currency or completeness of the Cotality Data and to the full extent permitted by law excludes all loss or damage howsoever arising (including through negligence) in connection with the Cotality Data.
This product uses cookies and other similar technologies to improve and customise your browsing experience, to tailor content and adverts, and for analytics and metrics regarding visitor usage on this product and other media. We may share cookie and analytics information with third parties for the purposes of advertising. By continuing to use our website, you consent to cookies being used. View our Privacy Policy here.
X