
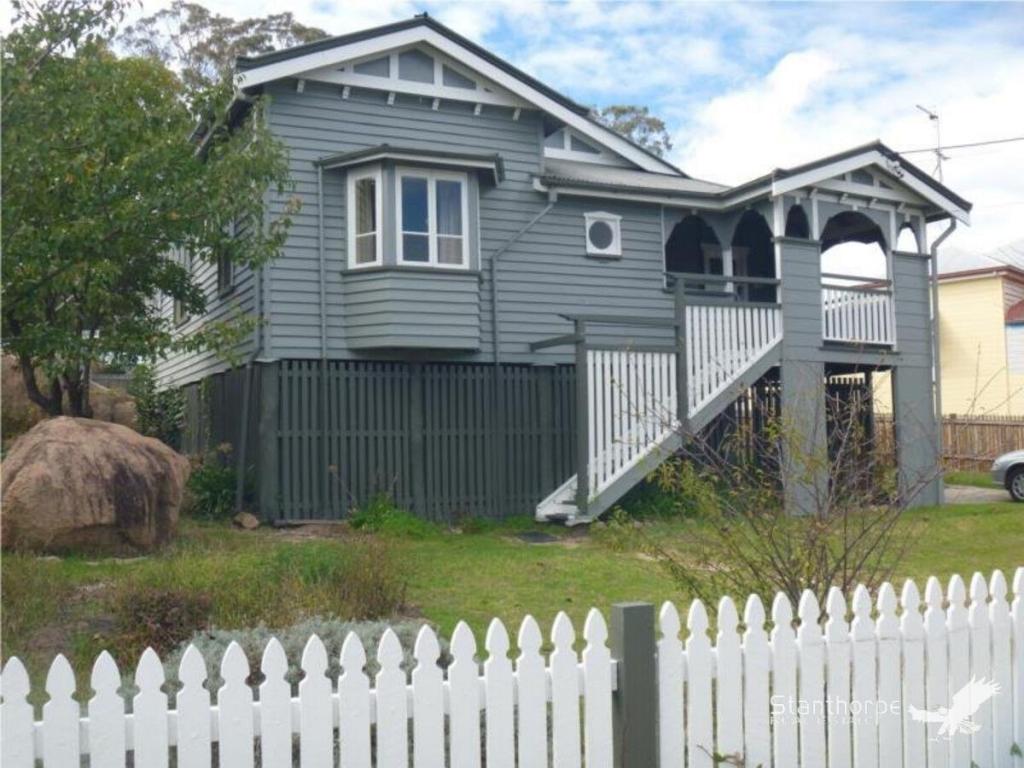
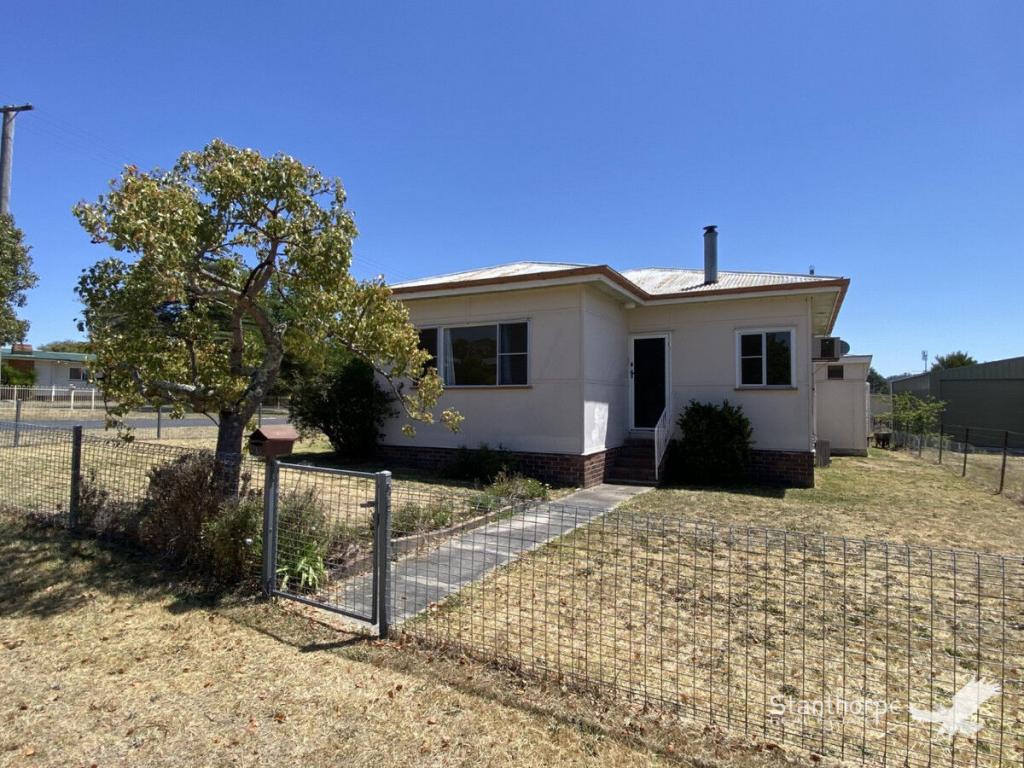
23 Wallangarra RoadStanthorpe QLD 4380

Thinking about insurance?
Get estimated rebuild costs for this property with Sum SureProperty Details for 23 Wallangarra Rd, Stanthorpe
23 Wallangarra Rd, Stanthorpe is a bedroom, bathroom House. The property has a land size of 812m2 and floor size of 135m2. While the property is not currently for sale or for rent, it was last sold in August 2000.
Property History for 23 Wallangarra Rd, Stanthorpe, QLD 4380
- 14 Aug 2000Sold for $50,000

Recent sales nearby
See more recent sales nearby
Similar properties For Sale nearby
See more properties for sale nearby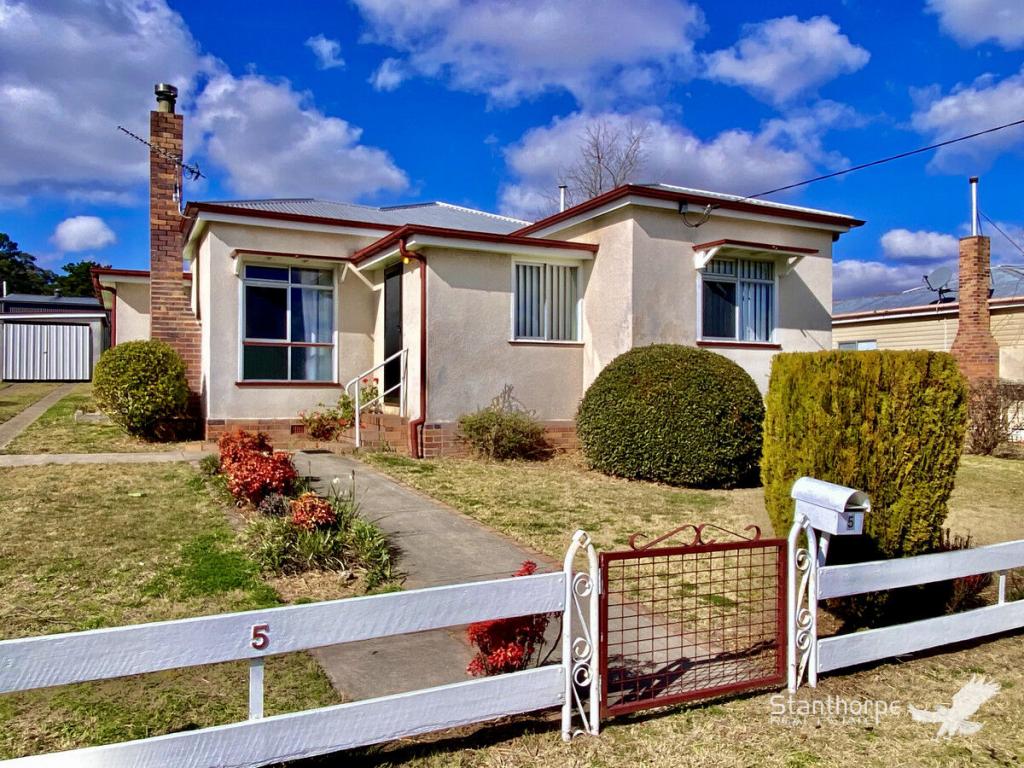
Similar properties For Rent nearby
See more properties for rent nearby
About Stanthorpe 4380
The size of Stanthorpe is approximately 33.8 square kilometres. It has 24 parks covering nearly 2.0% of total area. The population of Stanthorpe in 2016 was 5406 people. By 2021 the population was 5286 showing a population decline of 2.2% in the area during that time. The predominant age group in Stanthorpe is 60-69 years. Households in Stanthorpe are primarily childless couples and are likely to be repaying $1000 - $1399 per month on mortgage repayments. In general, people in Stanthorpe work in a labourer occupation.In 2021, 65.70% of the homes in Stanthorpe were owner-occupied compared with 63.80% in 2016..
Stanthorpe has 3,312 properties. Over the last 5 years, Houses in Stanthorpe have seen a 112.34% increase in median value, while Units have seen a 74.73% increase. As at 30 June 2025:
- The median value for Houses in Stanthorpe is $510,205 while the median value for Units is $397,985.
- Houses have a median rent of $460 while Units have a median rent of $330.
What's around 23 Wallangarra Rd, Stanthorpe
23 Wallangarra Rd, Stanthorpe is in the school catchment zone for Stanthorpe State School and Stanthorpe State High School.


Suburb Insights for Stanthorpe 4380
Market Insights
Stanthorpe Trends for Houses
N/A
N/A
View TrendN/A
N/A
Stanthorpe Trends for Units
N/A
N/A
View TrendN/A
N/A
Neighbourhood Insights
Age
Population 5,286
0-9
9%
10-19
12%
20-29
8%
30-39
10%
40-49
10%
50-59
12%
60-69
16%
70-79
15%
80-89
7%
90-99
2%
Household Structure
Occupancy
This product uses cookies and other similar technologies to improve and customise your browsing experience, to tailor content and adverts, and for analytics and metrics regarding visitor usage on this product and other media. We may share cookie and analytics information with third parties for the purposes of advertising. By continuing to use our website, you consent to cookies being used. View our Privacy Policy here.
X