
9 Spinnaker StreetSouth Mission Beach QLD 4852
Property Details for 9 Spinnaker St, South Mission Beach
Last Listing description (August 2024)
* Just over 1/4 Acre
* Underground Services
* Backing onto Boundary of Trees
Build your single story house, your shed or double story for Dunk Island views!
It's slightly elevated from the road and has a picturesque rear boundary of established trees, there's a house to the north and a vacant block on the southern side.
Stroll approximately 420 meters to enjoy walks along the beach and island views. South Mission Beach also has a soon to open coffee shop, cafe at the caravan park and the Surf Club.
So affordable by the beach! Marketed exclusively by Tania @ Tropical Property.
Property Code: 2763
Property History for 9 Spinnaker St, South Mission Beach, QLD 4852
- 11 Jul 2024Sold for $155,000
- 21 Mar 2024Listed for Sale $160k
- 13 Jun 2016Sold for $79,000
Recent sales nearby
See more recent sales nearby
Similar properties For Sale nearby
See more properties for sale nearby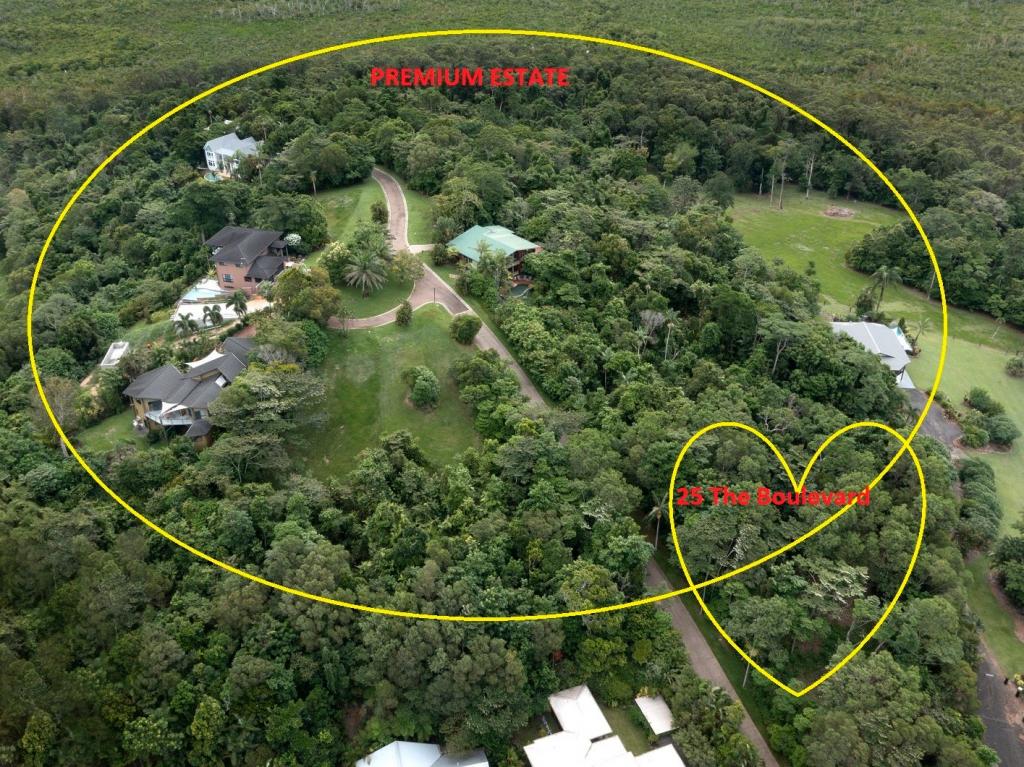 0
0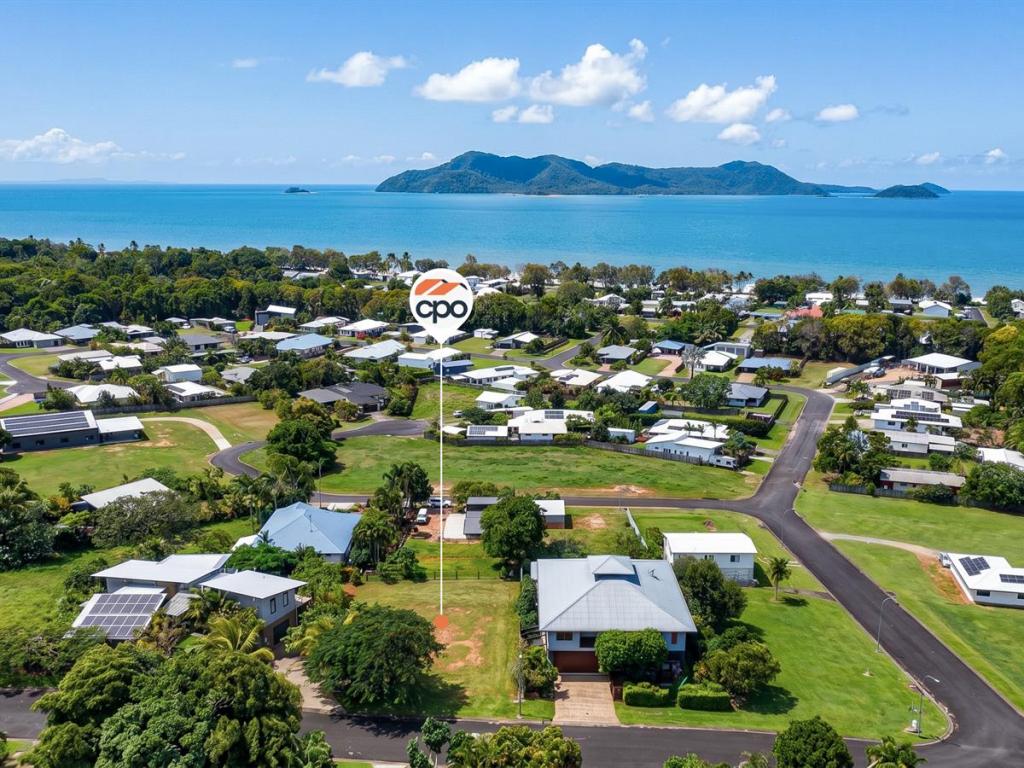 0
0 0
0
About South Mission Beach 4852
The size of South Mission Beach is approximately 20.3 square kilometres. There are 3 parks, covering nearly 68.8% of the total area. The population of South Mission Beach in 2016 was 932 people. By 2021 the population was 968 showing a population growth of 3.9% in the area during that time. The predominant age group in South Mission Beach is 60-69 years. Households in South Mission Beach are primarily childless couples and are likely to be repaying $1000 - $1399 per month on mortgage repayments. In general, people in South Mission Beach work in a professional occupation.In 2021, 69.80% of the homes in South Mission Beach were owner-occupied compared with 64.20% in 2016.
South Mission Beach has 849 properties. Over the last 5 years, Houses in South Mission Beach have seen a 49.98% increase in median value. As at 30 June 2026:
- The median value for Houses in South Mission Beach is $713,207 while the median value for Units is $358,014.
Suburb Insights for South Mission Beach 4852
Market Insights
South Mission Beach Trends for Houses
N/A
N/A
View TrendN/A
N/A
South Mission Beach Trends for Units
N/A
N/A
View TrendN/A
N/A
Neighbourhood Insights
© Copyright 2026. RP Data Pty Ltd trading as Cotality (Cotality). All rights reserved. No reproduction, distribution, or transmission of the copyrighted materials is permitted. The information is deemed reliable but not guaranteed.
While Cotality uses commercially reasonable efforts to ensure the Cotality Data is current, Cotality does not warrant the accuracy, currency or completeness of the Cotality Data and to the full extent permitted by law excludes all loss or damage howsoever arising (including through negligence) in connection with the Cotality Data.
This product uses cookies and other similar technologies to improve and customise your browsing experience, to tailor content and adverts, and for analytics and metrics regarding visitor usage on this product and other media. We may share cookie and analytics information with third parties for the purposes of advertising. By continuing to use our website, you consent to cookies being used. View our Privacy Policy here.
X