
7 Parsons StreetRothwell QLD 4022
Property Details for 7 Parsons St, Rothwell
7 Parsons St, Rothwell is a 3 bedroom, 1 bathroom House with 2 parking spaces and was built in 1975. The property has a land size of 625m2 and floor size of 77m2. While the property is not currently for sale or for rent, it was last sold in February 2016.
Last Listing description (November 2024)
Neat and tidy this high set home in Rothwell will be available shortly to move in and make it your home!
- Neatly presented 3 bedroom home
- Polished floor boards
- Modern Kitchen
- Modern bathroom
- Easy access to all amenities
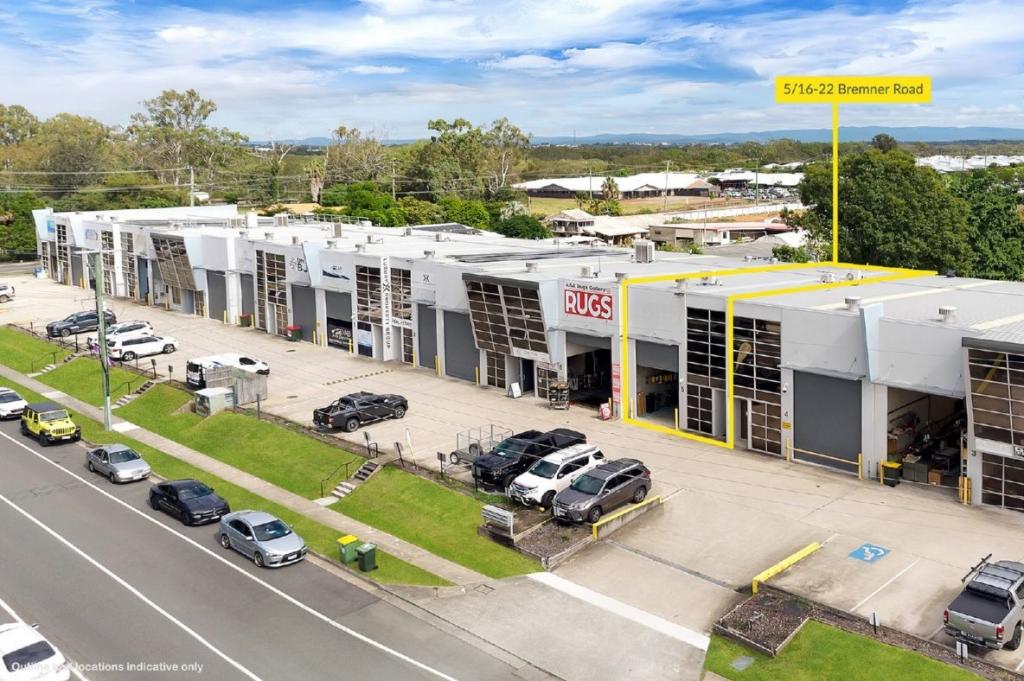
- Just a short distance to highway and public transport
- Fully fenced
- Double garage
- And plenty of space for the boat or trailer
*Please pre-apply for property. Once your application has been received you will be contacted to organise a viewing of the property.
*Disclaimer* Whilst every care is taken in the preparation of the information contained herein, Crown Properties will not be held liable for any errors in photography, typing or information. All information is considered correct at the time of listing. Any interested parties should make their own sound decision prior to applying.
Property History for 7 Parsons St, Rothwell, QLD 4022
- 09 Oct 2024Listed for Rent $565 / week
- 22 Oct 2021Listed for Rent $430 / week
- 02 Sep 2019Listed for Rent - Price not available

Recent sales nearby
See more recent sales nearbySimilar properties For Sale nearby
See more properties for sale nearby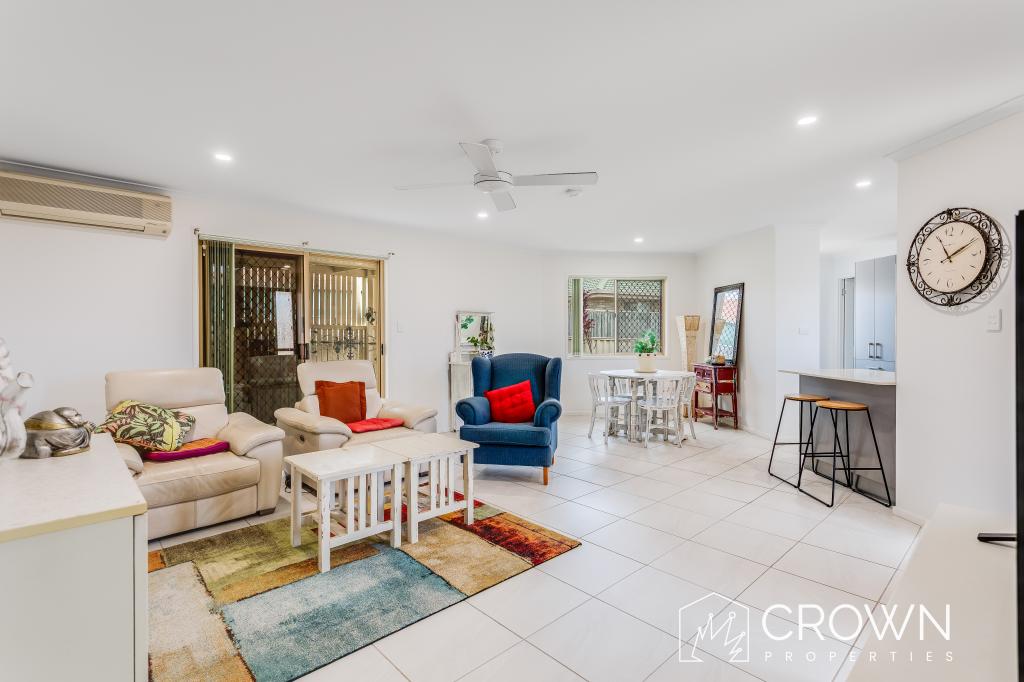 0
0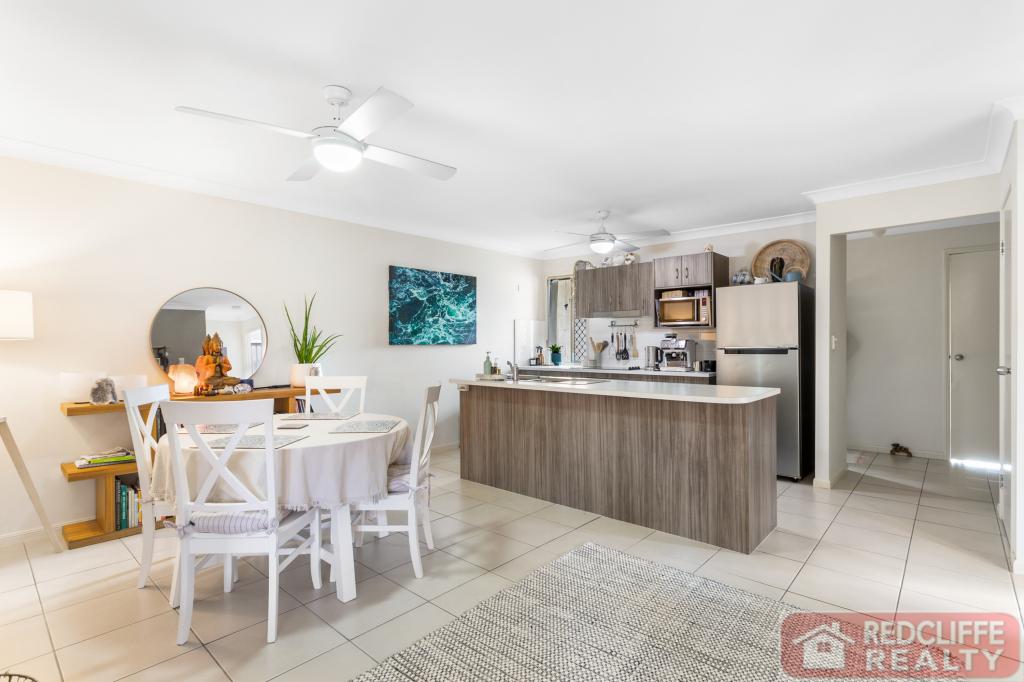 0
0Similar properties For Rent nearby
See more properties for rent nearby
 0
0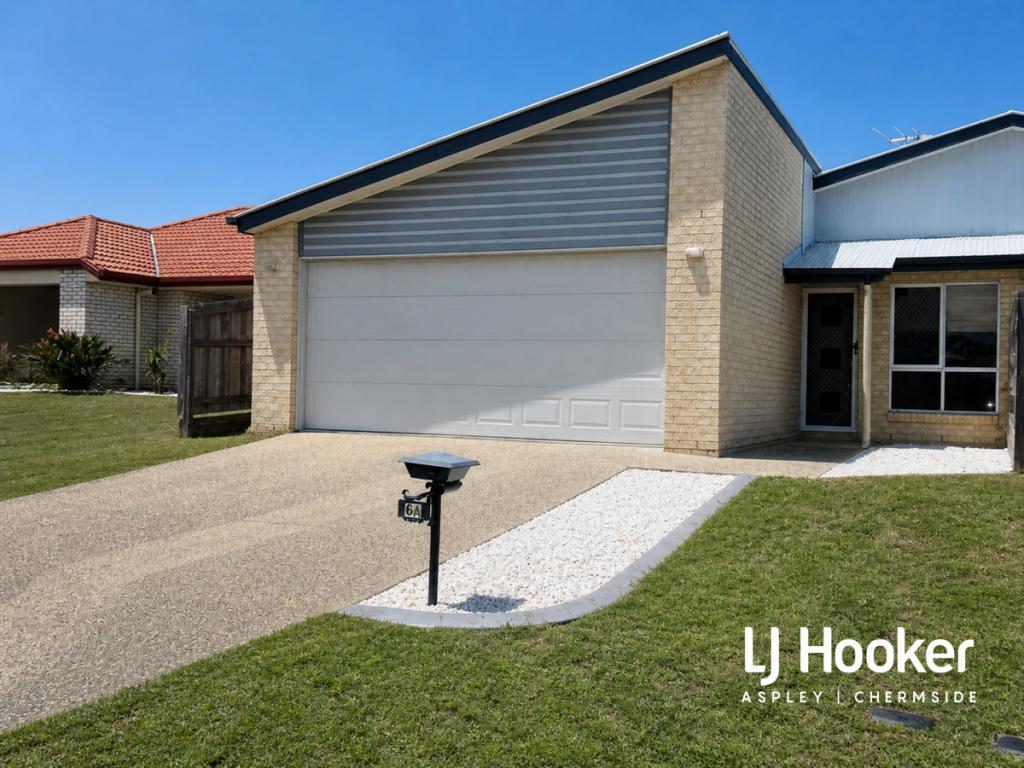 0
0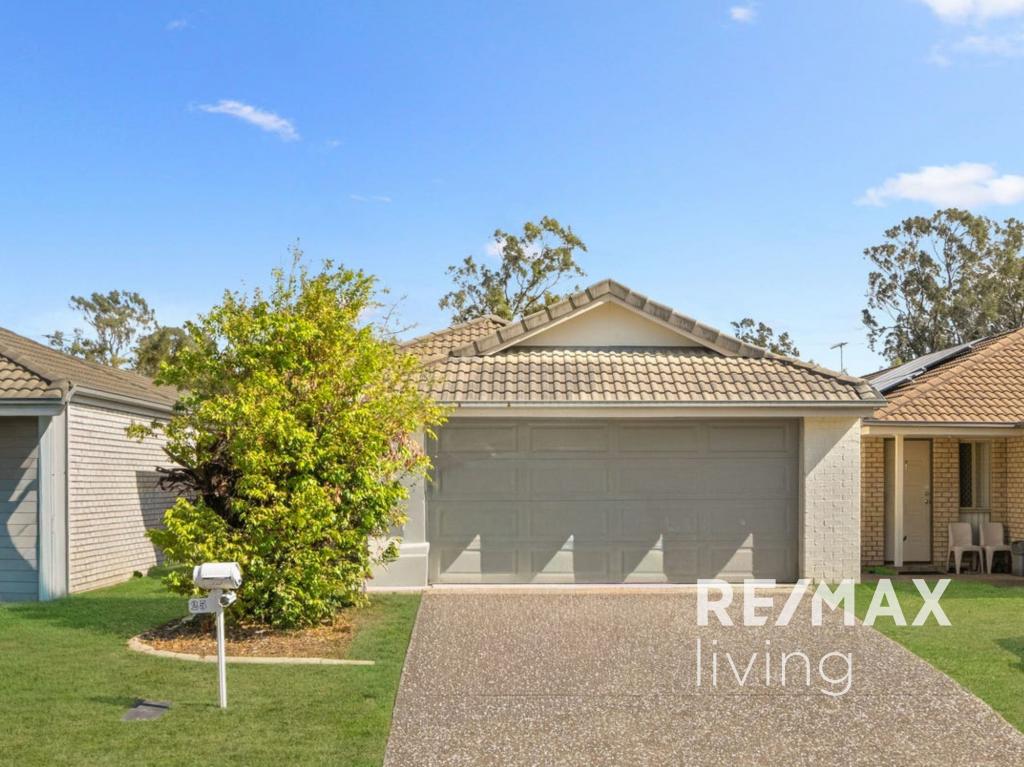 0
0About Rothwell 4022
The size of Rothwell is approximately 10.3 square kilometres. It has 35 parks covering nearly 17.3% of total area. The population of Rothwell in 2016 was 7165 people. By 2021 the population was 7538 showing a population growth of 5.2% in the area during that time. The predominant age group in Rothwell is 10-19 years. Households in Rothwell are primarily childless couples and are likely to be repaying $1800 - $2399 per month on mortgage repayments. In general, people in Rothwell work in a community and personal service occupation.In 2021, 52.60% of the homes in Rothwell were owner-occupied compared with 52.90% in 2016.
Rothwell has 3,118 properties. Over the last 5 years, Houses in Rothwell have seen a 101.76% increase in median value, while Units have seen a 107.71% increase. As at 31 March 2026:
- The median value for Houses in Rothwell is $1,019,927 while the median value for Units is $652,543.
- Houses have a median rent of $635 while Units have a median rent of $500.
Suburb Insights for Rothwell 4022
Market Insights
Rothwell Trends for Houses
N/A
N/A
View TrendN/A
N/A
Rothwell Trends for Units
N/A
N/A
View TrendN/A
N/A
Neighbourhood Insights
© Copyright 2026. RP Data Pty Ltd trading as Cotality (Cotality). All rights reserved. No reproduction, distribution, or transmission of the copyrighted materials is permitted. The information is deemed reliable but not guaranteed.
While Cotality uses commercially reasonable efforts to ensure the Cotality Data is current, Cotality does not warrant the accuracy, currency or completeness of the Cotality Data and to the full extent permitted by law excludes all loss or damage howsoever arising (including through negligence) in connection with the Cotality Data.
This product uses cookies and other similar technologies to improve and customise your browsing experience, to tailor content and adverts, and for analytics and metrics regarding visitor usage on this product and other media. We may share cookie and analytics information with third parties for the purposes of advertising. By continuing to use our website, you consent to cookies being used. View our Privacy Policy here.
X