
90 Marine ParadeNewell QLD 4873
Property Details for 90 Marine Pde, Newell
90 Marine Pde, Newell is a 3 bedroom, 1 bathroom House with 3 parking spaces. The property has a land size of 607m2 and floor size of 100m2.
Last Listing description (November 2025)
This neat and tidy family beach home is on the market and it's now time to be loved by someone else. Straight opposite the beach so the location is PRIME. Morning coffee on the patio watching the sun come up or just enjoy the sounds of the waves.
This home is suitable for a young family or those looking to downsize in a great beachside location. It has everything you need with 3 bedrooms, family bathroom, 2 toilets, a large shed, side access to the back garden, and room for a pool. 90 Marine Parade was purchased by a local family, and current owner and gradually transformed into the family home it is today. You will never replace this desirable location.
So close to everything you need, with Port Douglas literally across the inlet or 20 mins by car for dining, Markets on Sundays or just to do a spot of shopping in Macrossan St. With school bus transfers to local Primary and High Schools of Mossman, after school activities it's all on your doorstep. Newell is a fabulous place to live with local Take Away just down the road, upgraded boat ramp & Mossman Fishing Club for the keen angler, Mossman Golf Club at the entrance to Newell Beach and Mossman just minutes away. So close you can ride your bike!
THE BEST BITS:
* Set on a 607sqm block
* 3 bedrooms, Master with a/c and full wall wardrobe with mirror doors, 2nd bedroom with electric shutters & a/c, 3rd bedroom or Office space
* Family bathroom with recently renovated with easy walk in shower & floor to ceiling tile look panelling
+ Outdoor shower for washing off the sand after your walk on the beach
* Separate toilet with the added bonus of an extra toilet - yes 2 toilets!
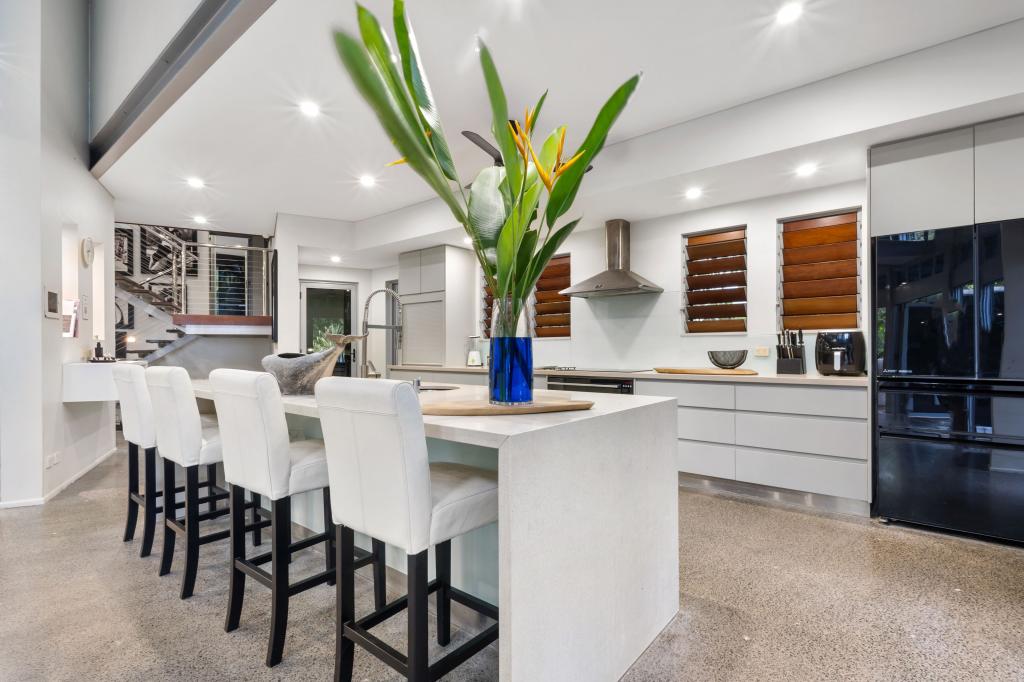
* Light and open dining and lounge room
* Five sets of electric storm/security shutters installed in 2022/2023
* Newly renovated galley kitchen incorporating living and dining area also with air-conditioning & ability to lock off from the rest of house
* EAST facing front undercover patio
* Large rear entertaining area at the rear overlooking back yard
* Spacious rear family/entertaining room - fully tiled
* Large 3 bay shed (9m x 7m) with high 3m opening in two bays and open 3rd bay
* Side access for the car, boat, camper or trailer
* Less than 500m to Newell Beach Takeaway for Pizza, fish and chips & just down the road from the NEW boat ramp and straight out Mossman River to the Reef
* Less than 10minutes to Mossman
So, if you're looking for a wonderful holiday home or a place to put your stamp on and make your permanent home, then this is it! Be quick and you could be enjoying the beach lifestyle sooner than you think.
To arrange your private inspection and experience Newell, call Nicole on 0416 033 948 or email nicole@propertyshopmossman.
Property History for 90 Marine Pde, Newell, QLD 4873
- 23 Aug 2024Listed for Sale NOW $790,000

Recent sales nearby
See more recent sales nearby
Similar properties For Sale nearby
See more properties for sale nearby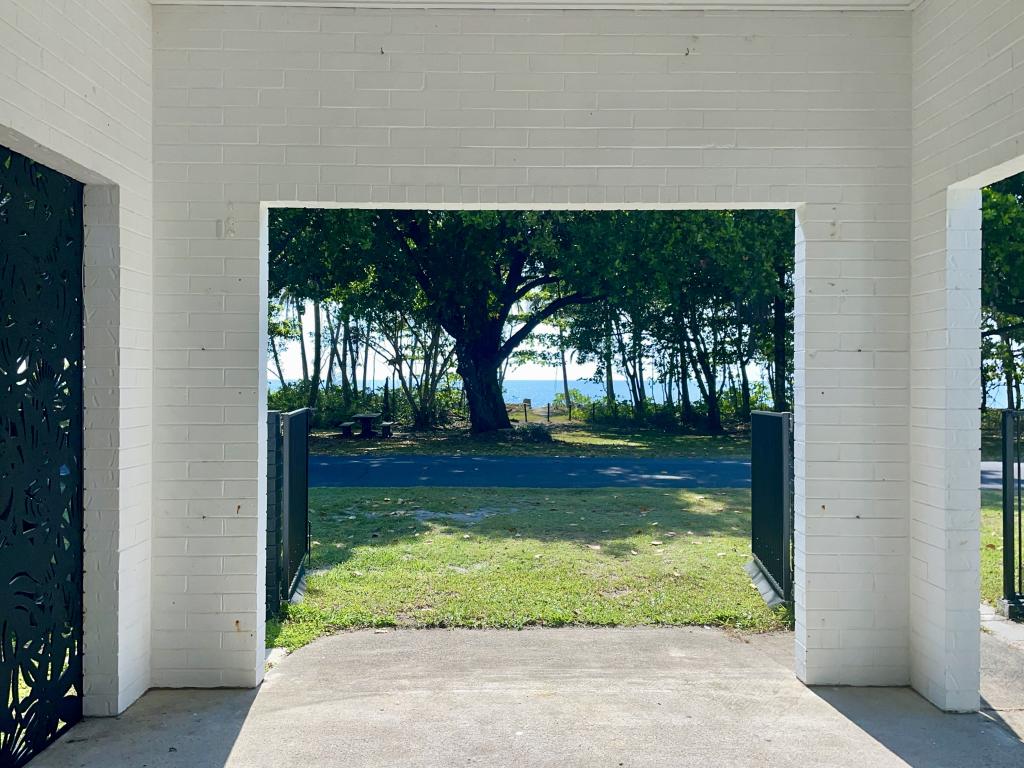 0
0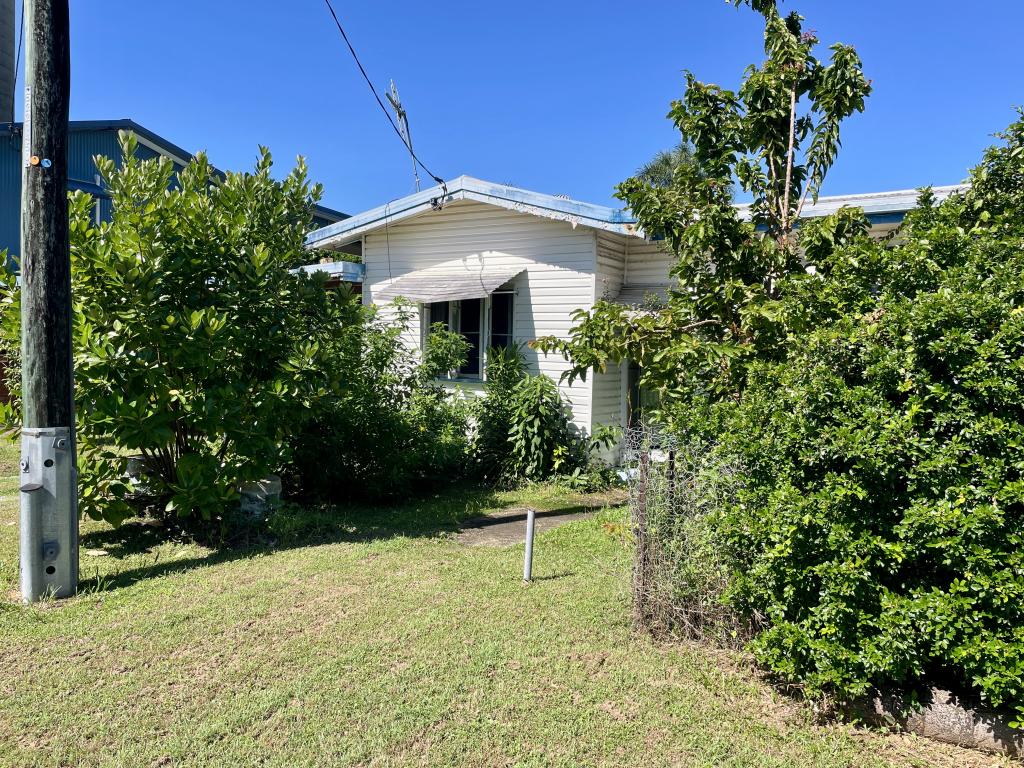 0
0
 0
0Similar properties For Rent nearby
See more properties for rent nearby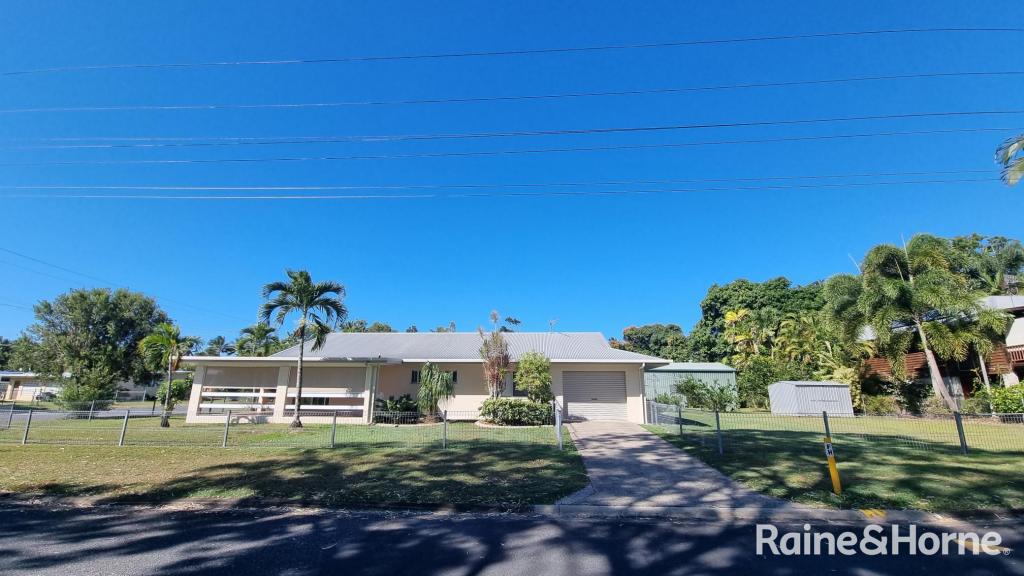 0
0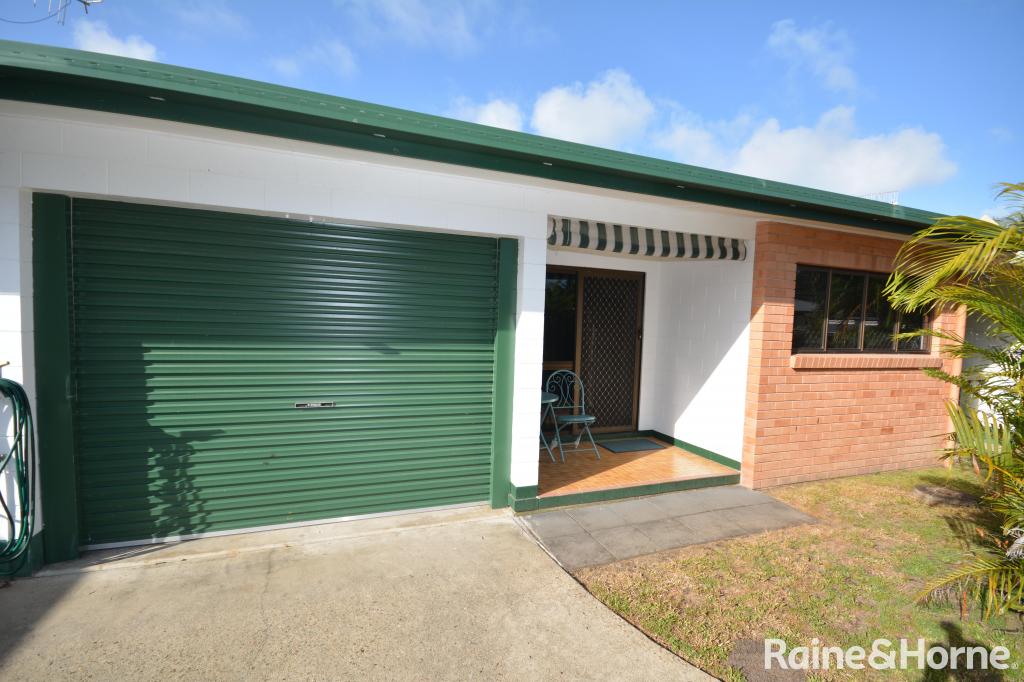 0
0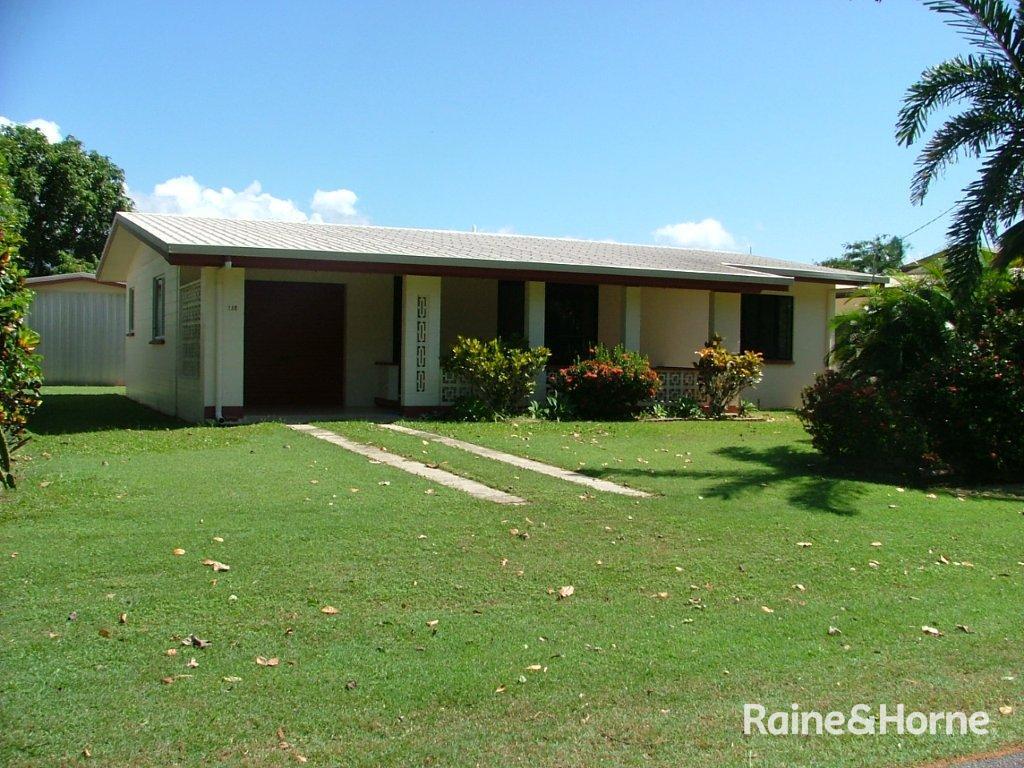 0
0About Newell 4873
The size of Newell is approximately 7.3 square kilometres. There are 5 parks, covering nearly 14.2% of the total area. The population of Newell in 2016 was 336 people. By 2021 the population was 327 showing a population decline of 2.7% in the area during that time. The predominant age group in Newell is 50-59 years. Households in Newell are primarily childless couples and are likely to be repaying $1400 - $1799 per month on mortgage repayments. In general, people in Newell work in a trades occupation.In 2021, 67.90% of the homes in Newell were owner-occupied compared with 69.00% in 2016.
Newell has 245 properties. Over the last 5 years, Houses in Newell have seen a 62.19% increase in median value, while Units have seen a 48.01% increase. As at 30 April 2026:
- The median value for Houses in Newell is $805,320 while the median value for Units is $348,429.
- Houses have a median rent of $640.
Suburb Insights for Newell 4873
Market Insights
Newell Trends for Houses
N/A
N/A
View TrendN/A
N/A
Newell Trends for Units
N/A
N/A
View TrendN/A
N/A
Neighbourhood Insights
© Copyright 2026. RP Data Pty Ltd trading as Cotality (Cotality). All rights reserved. No reproduction, distribution, or transmission of the copyrighted materials is permitted. The information is deemed reliable but not guaranteed.
While Cotality uses commercially reasonable efforts to ensure the Cotality Data is current, Cotality does not warrant the accuracy, currency or completeness of the Cotality Data and to the full extent permitted by law excludes all loss or damage howsoever arising (including through negligence) in connection with the Cotality Data.
This product uses cookies and other similar technologies to improve and customise your browsing experience, to tailor content and adverts, and for analytics and metrics regarding visitor usage on this product and other media. We may share cookie and analytics information with third parties for the purposes of advertising. By continuing to use our website, you consent to cookies being used. View our Privacy Policy here.
X