
52 Marine ParadeNewell QLD 4873
Property Details for 52 Marine Pde, Newell
52 Marine Pde, Newell is a 3 bedroom, 1 bathroom House with 1 parking spaces and was built in 1960. The property has a land size of 607m2 and floor size of 105m2. While the property is not currently for sale or for rent, it was last sold in December 2000.
Last Listing description (November 2015)
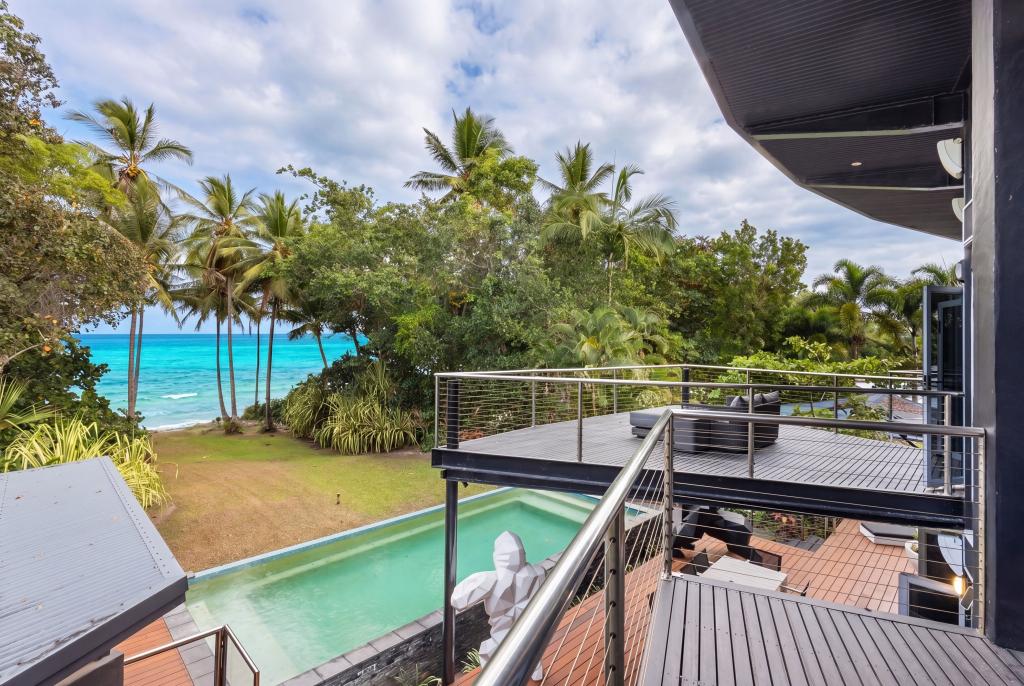
PRICE REDUCED TO SELL! Located on the beachfront at Newell Beach this beach house has been restored and oozes charm. Laze away in your out door cabana over looking the formal pool or enjoy the views through the park to the coral sea from the front of the house. If you have been looking for a beach house that is a little different then look no further. The current owners have started to successfully holiday let the house to holiday makers which is becoming very lucrative. More information on the holiday letting is available on request. To organize an inspection contact Mark Flinn on 0405 646 313.
Property History for 52 Marine Pde, Newell, QLD 4873
- 27 Aug 2011Listed for Sale $595,000
- 28 Dec 2000Sold for $135,000

Recent sales nearby
See more recent sales nearby
Similar properties For Sale nearby
See more properties for sale nearby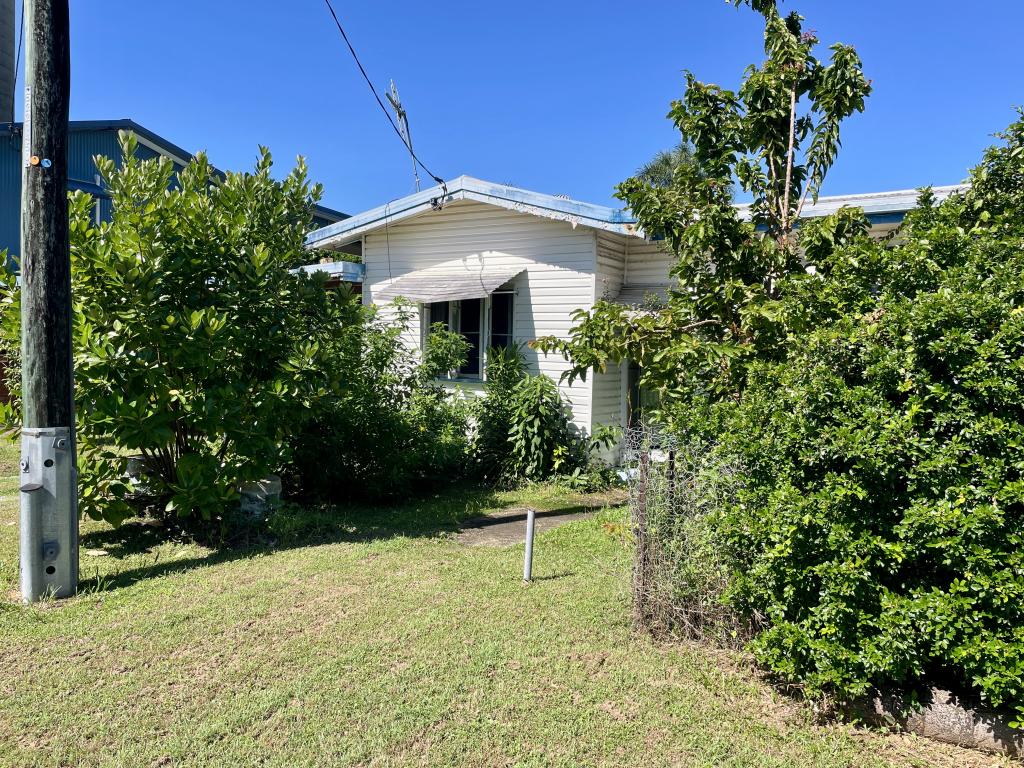 0
0
 0
0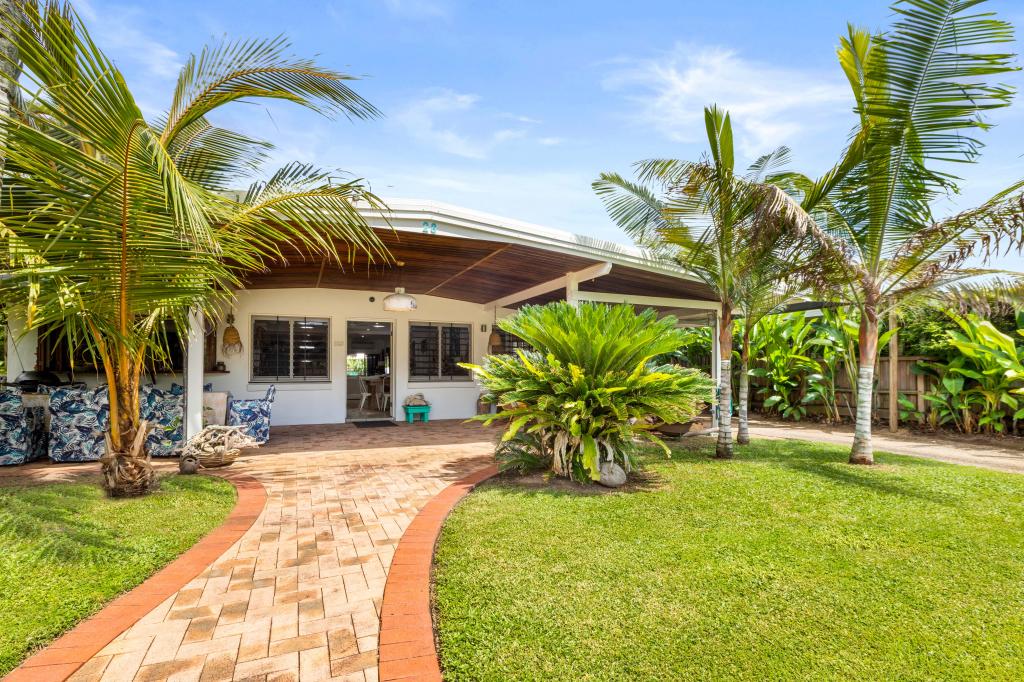 0
0Similar properties For Rent nearby
See more properties for rent nearby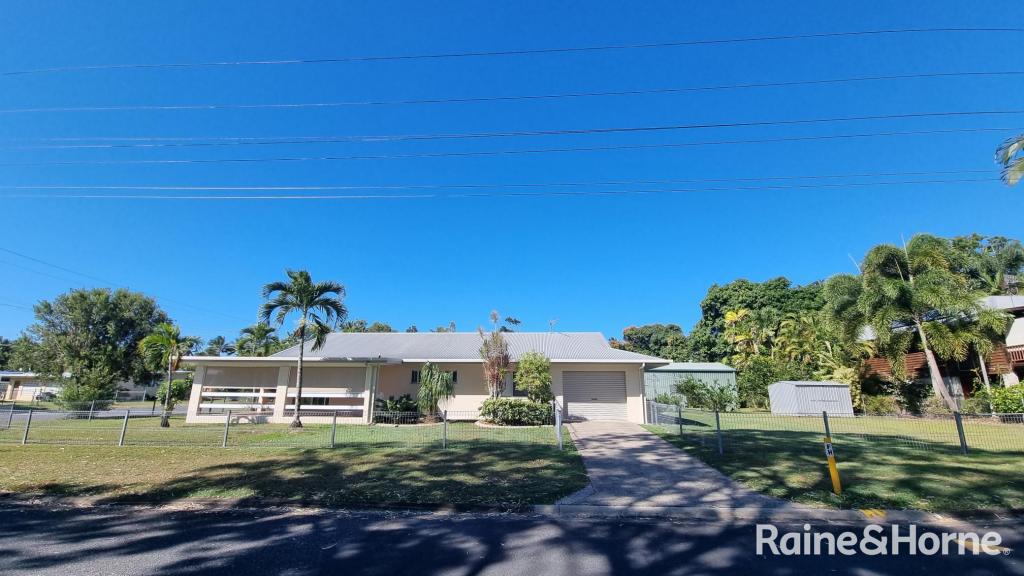 0
0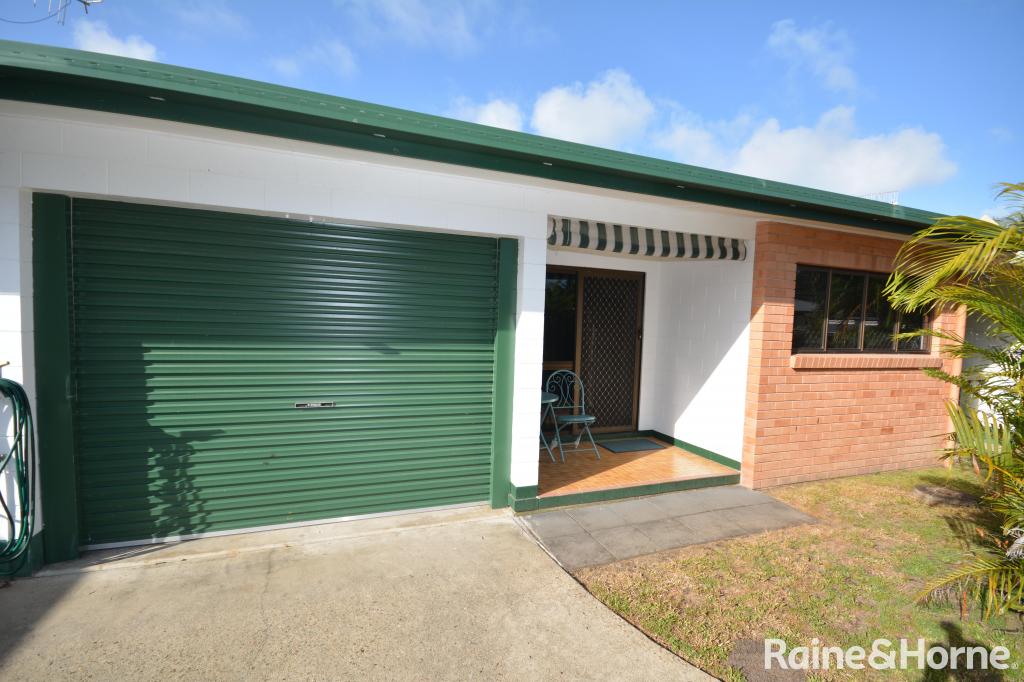 0
0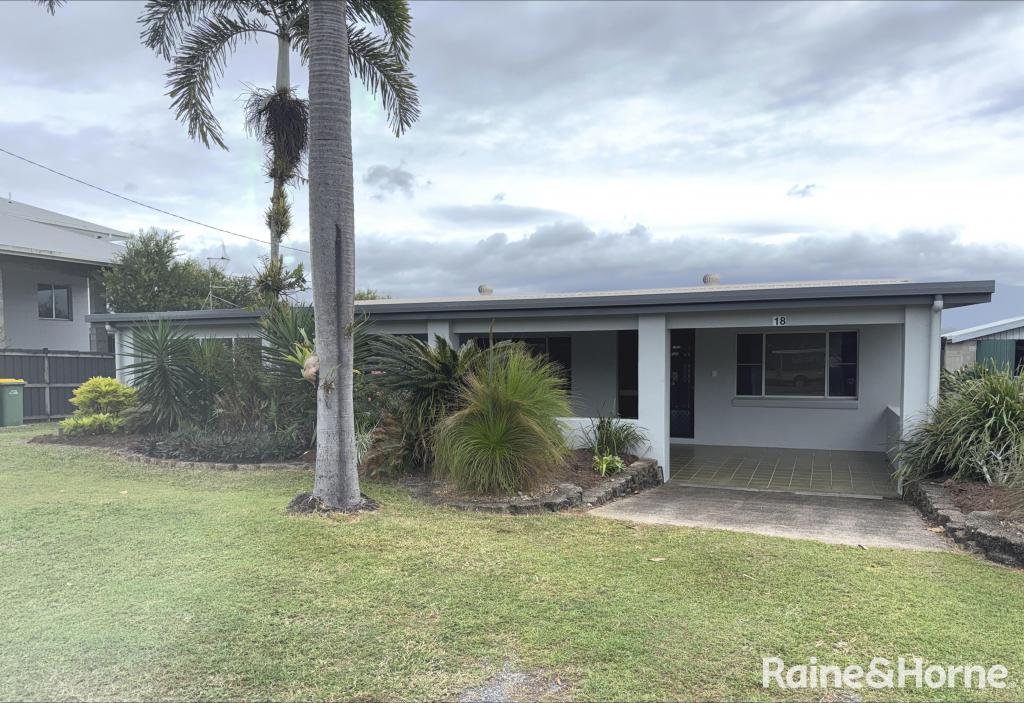 0
0About Newell 4873
The size of Newell is approximately 7.3 square kilometres. There are 5 parks, covering nearly 14.2% of the total area. The population of Newell in 2016 was 336 people. By 2021 the population was 327 showing a population decline of 2.7% in the area during that time. The predominant age group in Newell is 50-59 years. Households in Newell are primarily childless couples and are likely to be repaying $1400 - $1799 per month on mortgage repayments. In general, people in Newell work in a trades occupation.In 2021, 67.90% of the homes in Newell were owner-occupied compared with 69.00% in 2016.
Newell has 244 properties. Over the last 5 years, Houses in Newell have seen a 83.32% increase in median value, while Units have seen a 59.65% increase. As at 31 May 2026:
- The median value for Houses in Newell is $625,794 while the median value for Units is $375,617.
- Houses have a median rent of $645.
Suburb Insights for Newell 4873
Market Insights
Newell Trends for Houses
N/A
N/A
View TrendN/A
N/A
Newell Trends for Units
N/A
N/A
View TrendN/A
N/A
Neighbourhood Insights
© Copyright 2026. RP Data Pty Ltd trading as Cotality (Cotality). All rights reserved. No reproduction, distribution, or transmission of the copyrighted materials is permitted. The information is deemed reliable but not guaranteed.
While Cotality uses commercially reasonable efforts to ensure the Cotality Data is current, Cotality does not warrant the accuracy, currency or completeness of the Cotality Data and to the full extent permitted by law excludes all loss or damage howsoever arising (including through negligence) in connection with the Cotality Data.
This product uses cookies and other similar technologies to improve and customise your browsing experience, to tailor content and adverts, and for analytics and metrics regarding visitor usage on this product and other media. We may share cookie and analytics information with third parties for the purposes of advertising. By continuing to use our website, you consent to cookies being used. View our Privacy Policy here.
X