
9 Seabiscuit CrescentKallangur QLD 4503
Property Details for 9 Seabiscuit Cres, Kallangur
9 Seabiscuit Cres, Kallangur is a 5 bedroom, 2 bathroom House with 2 parking spaces and was built in 2007. The property has a land size of 603m2 and floor size of 184m2. While the property is not currently for sale or for rent, it was last sold in January 2017.
Last Listing description (April 2017)
This home will suit the family who want something special. From lovely street appeal out front to the outdoor entertainment and salt water pool out the back this brick and tile home is a pleasure to view. Featuring 5 good sized rooms, all with built in robes and security screens, the master has a great walk in robe and ensuite, plus a separate study situated at the front entrance allows room for everyone. With separate air conditioned living areas, as well as a great kitchen and dining room leading to the outdoor patio entertaining will be a breeze. Tidy gardens, private rear fenced yard, 2 bay garage plus workshop with another roller door to the rear allow access if needed. There's also a 4.4 kw solar system on the roof.
This home would suit North Lakes buyers without the price tag. North Lakes is just 5 minutes away over the new plantation road overpass, a park is just around the corner and close to Dakabin schools, child care and train station. The owners have purchased elsewhere and are ready to go! available to view 7 days a week call now to arrange your inspection.
Property History for 9 Seabiscuit Cres, Kallangur, QLD 4503
- 10 Jan 2017Sold for $520,000
- 22 Dec 2016Listed for Sale Offers over $510,000
- 06 Jun 2006Sold for $164,950

Recent sales nearby
See more recent sales nearbySimilar properties For Sale nearby
See more properties for sale nearby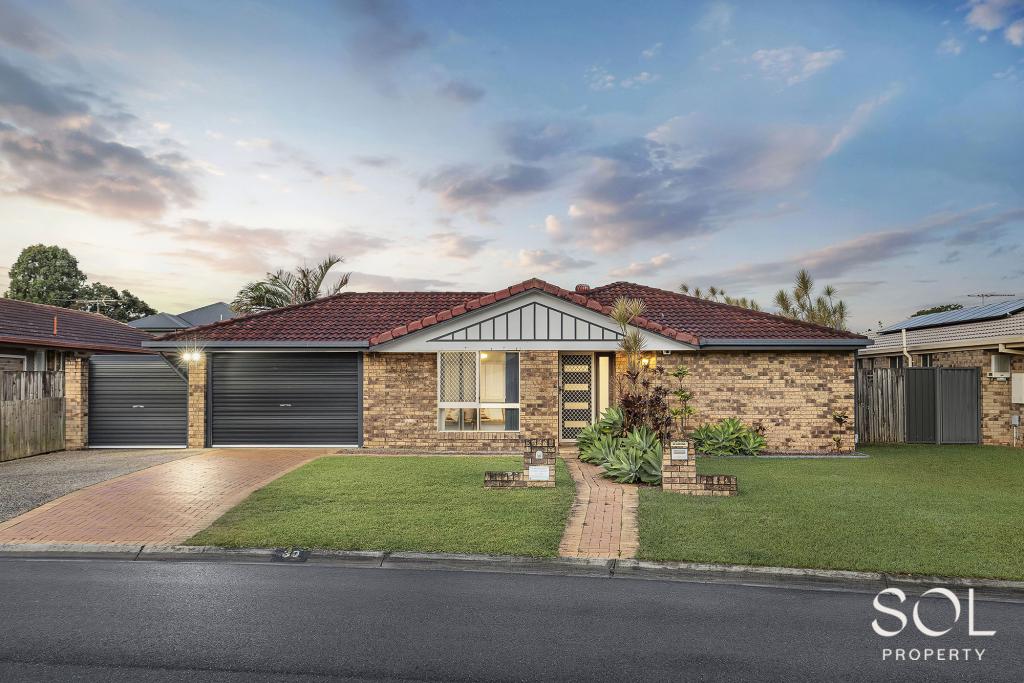 0
0 0
0
 0
0Similar properties For Rent nearby
See more properties for rent nearby 0
0 0
0About Kallangur 4503
The size of Kallangur is approximately 11.3 square kilometres. There are 64 parks, covering nearly 11.0% of the total area. The population of Kallangur in 2016 was 20405 people. By 2021 the population was 21761 showing a population growth of 6.6% in the area during that time. The predominant age group in Kallangur is 30-39 years. Households in Kallangur are primarily couples with children and are likely to be repaying $1400 - $1799 per month on mortgage repayments. In general, people in Kallangur work in a trades occupation.In 2021, 54.50% of the homes in Kallangur were owner-occupied compared with 58.30% in 2016.
Kallangur has 9,772 properties. Over the last 5 years, Houses in Kallangur have seen a 111.22% increase in median value, while Units have seen a 169.33% increase. As at 30 April 2026:
- The median value for Houses in Kallangur is $965,202 while the median value for Units is $776,591.
- Houses have a median rent of $600 while Units have a median rent of $535.
Suburb Insights for Kallangur 4503
Market Insights
Kallangur Trends for Houses
N/A
N/A
View TrendN/A
N/A
Kallangur Trends for Units
N/A
N/A
View TrendN/A
N/A
Neighbourhood Insights
© Copyright 2026. RP Data Pty Ltd trading as Cotality (Cotality). All rights reserved. No reproduction, distribution, or transmission of the copyrighted materials is permitted. The information is deemed reliable but not guaranteed.
While Cotality uses commercially reasonable efforts to ensure the Cotality Data is current, Cotality does not warrant the accuracy, currency or completeness of the Cotality Data and to the full extent permitted by law excludes all loss or damage howsoever arising (including through negligence) in connection with the Cotality Data.
This product uses cookies and other similar technologies to improve and customise your browsing experience, to tailor content and adverts, and for analytics and metrics regarding visitor usage on this product and other media. We may share cookie and analytics information with third parties for the purposes of advertising. By continuing to use our website, you consent to cookies being used. View our Privacy Policy here.
X