
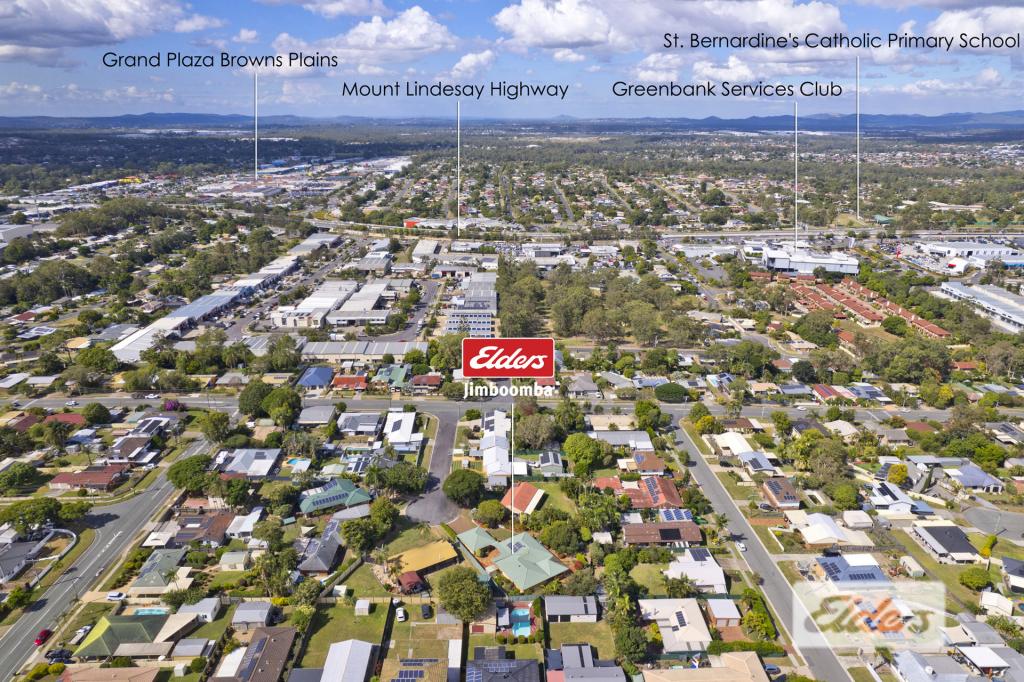
11 Bushmills CourtHillcrest QLD 4118
Property Details for 11 Bushmills Ct, Hillcrest
Last Listing description (May 2015)
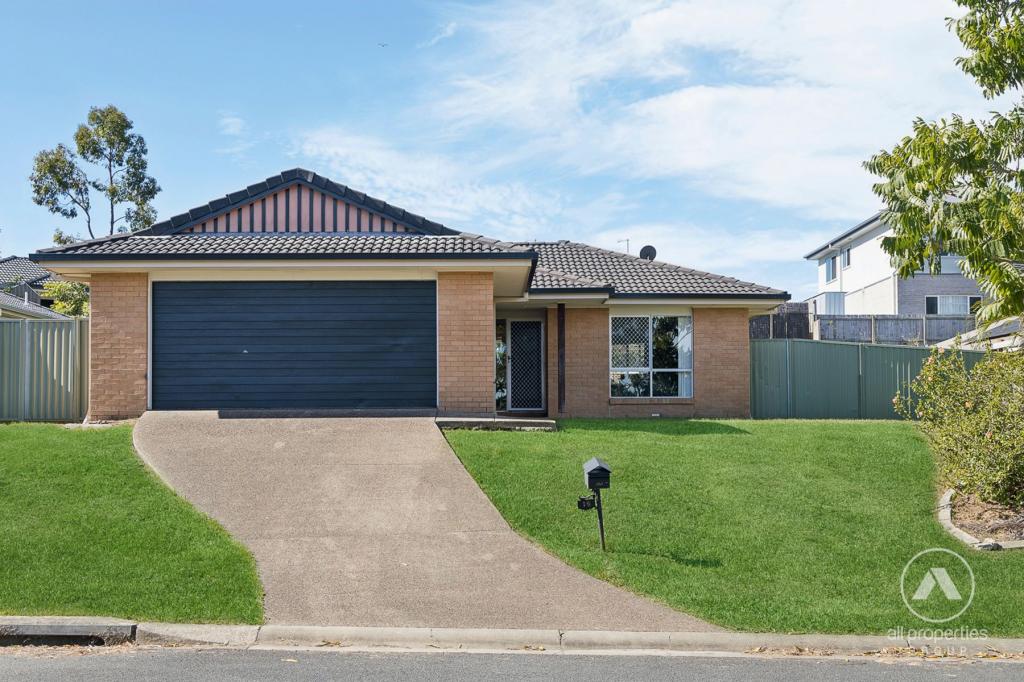
The owners have decided to sell this great investment property.
Earmarked in Logan City Council Planning Scheme as possible office site, this property would make a great investment.
It is currently tenanted by long term tenants who would love to stay.
3 Bedrooms, 2 with built in robes and 2 with Air Conditioning.
Bathroom
Kitchen/ Dining area
Good sized lounge with Air Conditioning.
Downstairs is built in with another room which is used as a bedroom with built in robe and air conditioning, bathroom, laundry and a large rumpus room.
There is side access to the large, fully fenced backyard with a garden shed.
Boasting 811m2 of land the opportunities are plentiful.
Property History for 11 Bushmills Ct, Hillcrest, QLD 4118
- 13 Apr 2015Sold for $320,000
- 30 Mar 2015Listed for Sale $330,000
- 20 Aug 2010Listed for Rent - Price not available
Recent sales nearby
See more recent sales nearby
Similar properties For Sale nearby
See more properties for sale nearby
 0
0
 0
0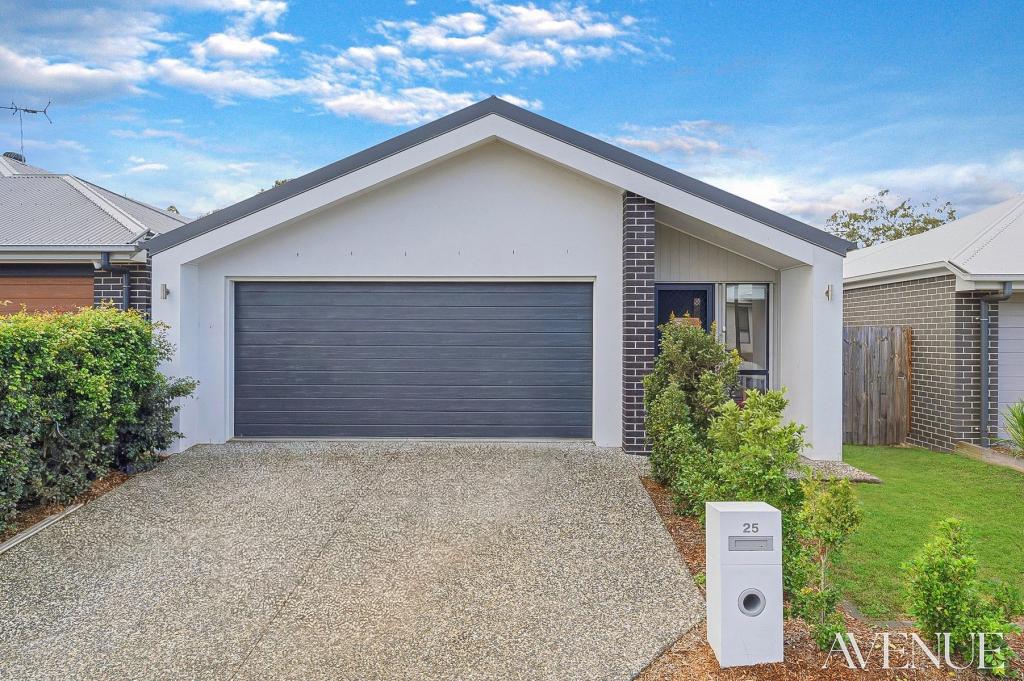 0
0Similar properties For Rent nearby
See more properties for rent nearby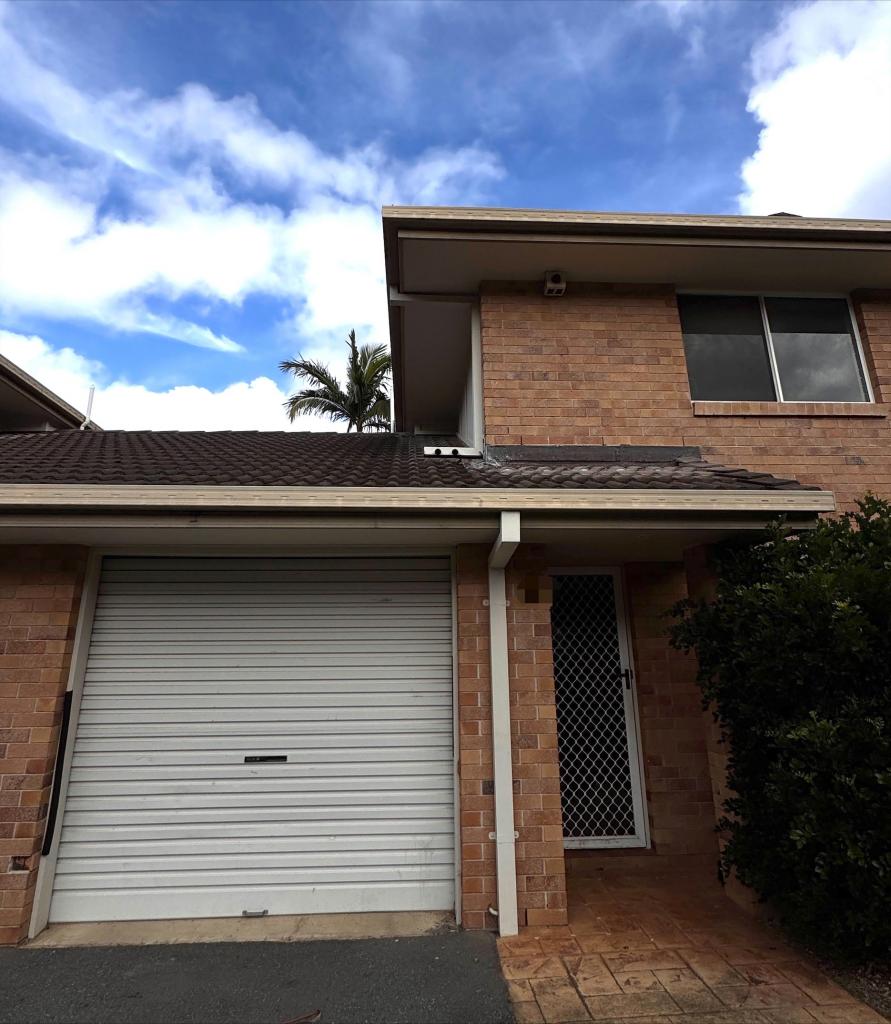 0
0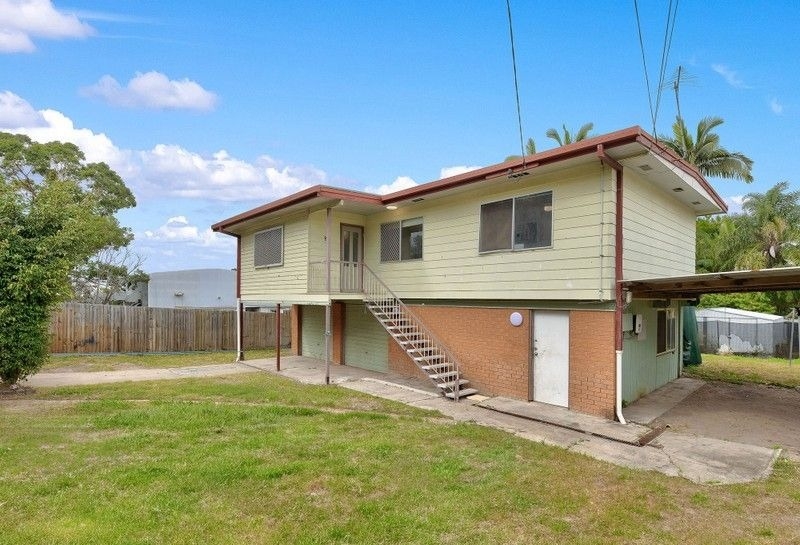 0
0 0
0About Hillcrest 4118
The size of Hillcrest is approximately 3.2 square kilometres. There are 14 parks, covering nearly 12.6% of the total area. The population of Hillcrest in 2016 was 5626 people. By 2021 the population was 6268 showing a population growth of 11.4% in the area during that time. The predominant age group in Hillcrest is 30-39 years. Households in Hillcrest are primarily couples with children and are likely to be repaying $1400 - $1799 per month on mortgage repayments. In general, people in Hillcrest work in a machinery operators and drivers occupation.In 2021, 58.80% of the homes in Hillcrest were owner-occupied compared with 57.70% in 2016.
Hillcrest has 3,208 properties. Over the last 5 years, Houses in Hillcrest have seen a 131.39% increase in median value, while Units have seen a 216.55% increase. As at 31 May 2026:
- The median value for Houses in Hillcrest is $1,031,307 while the median value for Units is $725,907.
- Houses have a median rent of $630 while Units have a median rent of $520.
Suburb Insights for Hillcrest 4118
Market Insights
Hillcrest Trends for Houses
N/A
N/A
View TrendN/A
N/A
Hillcrest Trends for Units
N/A
N/A
View TrendN/A
N/A
Neighbourhood Insights
© Copyright 2026. RP Data Pty Ltd trading as Cotality (Cotality). All rights reserved. No reproduction, distribution, or transmission of the copyrighted materials is permitted. The information is deemed reliable but not guaranteed.
While Cotality uses commercially reasonable efforts to ensure the Cotality Data is current, Cotality does not warrant the accuracy, currency or completeness of the Cotality Data and to the full extent permitted by law excludes all loss or damage howsoever arising (including through negligence) in connection with the Cotality Data.
This product uses cookies and other similar technologies to improve and customise your browsing experience, to tailor content and adverts, and for analytics and metrics regarding visitor usage on this product and other media. We may share cookie and analytics information with third parties for the purposes of advertising. By continuing to use our website, you consent to cookies being used. View our Privacy Policy here.
X