
131 Emmerson DriveGlenlee QLD 4711
Property Details for 131 Emmerson Dr, Glenlee
131 Emmerson Dr, Glenlee is a 3 bedroom, 2 bathroom House with 6 parking spaces and was built in 1998. The property has a land size of 4008m2 and floor size of 148m2. While the property is not currently for sale or for rent, it was last sold in April 2012.
Last Listing description (July 2026)
Positioned on a generous 4,008m block in one of Glenlee's most sought-after owner-occupied pockets, this lowset brick home offers the perfect balance of space, comfort and practicality.
Inside, you'll find two generous living areas (with the option to create a fourth bedroom), a renovated kitchen overlooking the open-plan living and dining space, and a privately positioned master suite complete with a walk-in robe and updated ensuite.
Designed for relaxed Queensland living, the home wraps around a large covered entertaining area overlooking the sparkling in-ground pool. Outside, the property features two powered sheds, a 6m x 6m carport, a fully fenced yard and the convenience of a remote electric front gate.
What you'll love:
Solar power and solar hot water
2nd living area or optional 4th bedroom
Remote electric front gate and fully fenced yard
7m x 6m powered shed with roller doors
6m x 6m powered dual-bay shed with workbench, storage racks and roller doors
6m x 6m carport
Large in-ground chlorine pool with 6m x 6m shade cover
Town water, septic system and 5,000L water tank
Security camera system
Bonus inclusions:
Fridge (approx. two years old)
Dishwasher and microwave
Television, Surround sound system with seven speakers and subwoofer
Husqvarna ride-on mower
Toro push mower
Offering the space, privacy and peaceful lifestyle Glenlee is renowned for, this is an acreage property the whole family will love. Contact Lachie Mulholland today to arrange your inspection.
Property History for 131 Emmerson Dr, Glenlee, QLD 4711
- 22 Jul 2026Listed for Sale Offers Over $1,050,000
- 23 Apr 2012Sold for $445,000
- 27 Mar 2012Listed for Sale $459,000

Recent sales nearby
See more recent sales nearbySimilar properties For Sale nearby
See more properties for sale nearby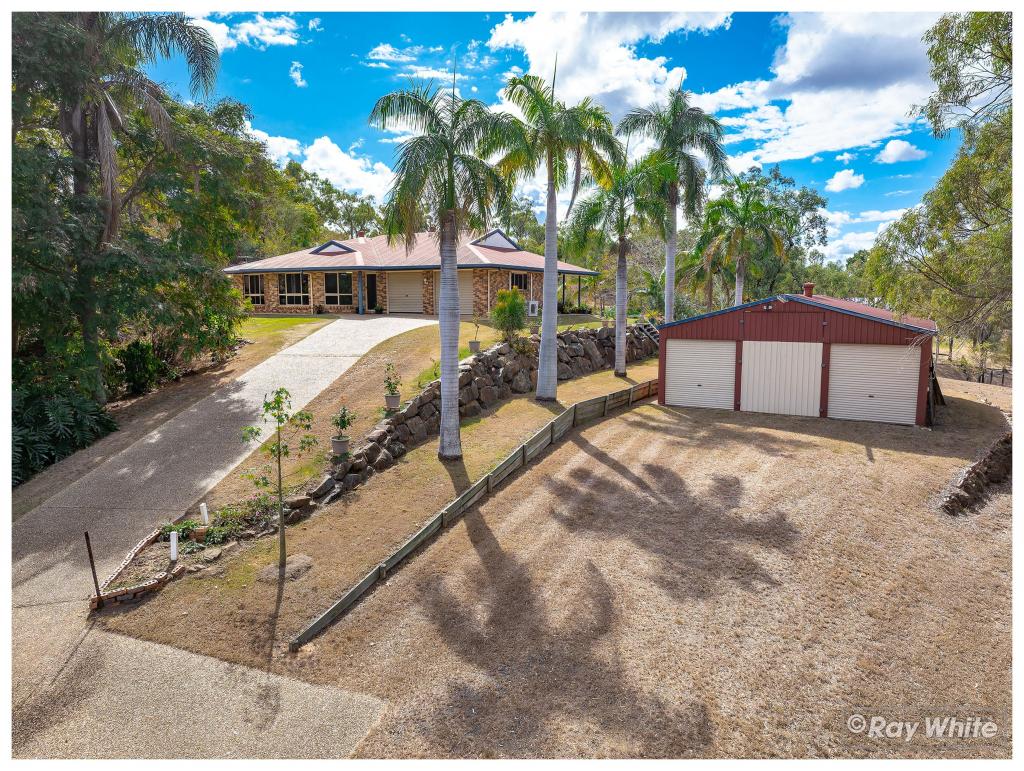 0
0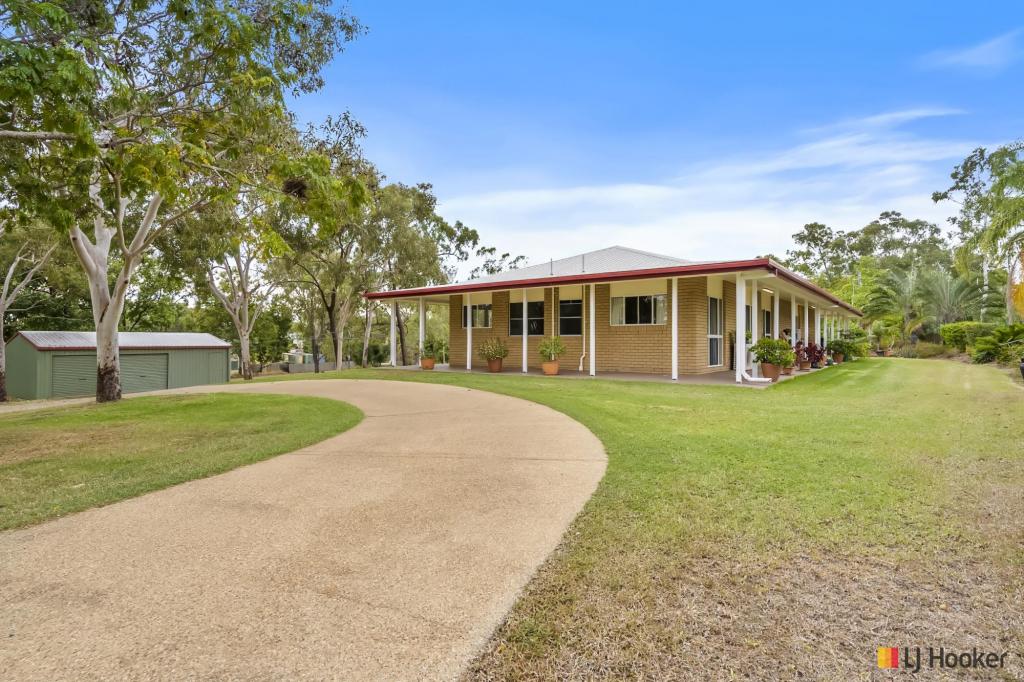 0
0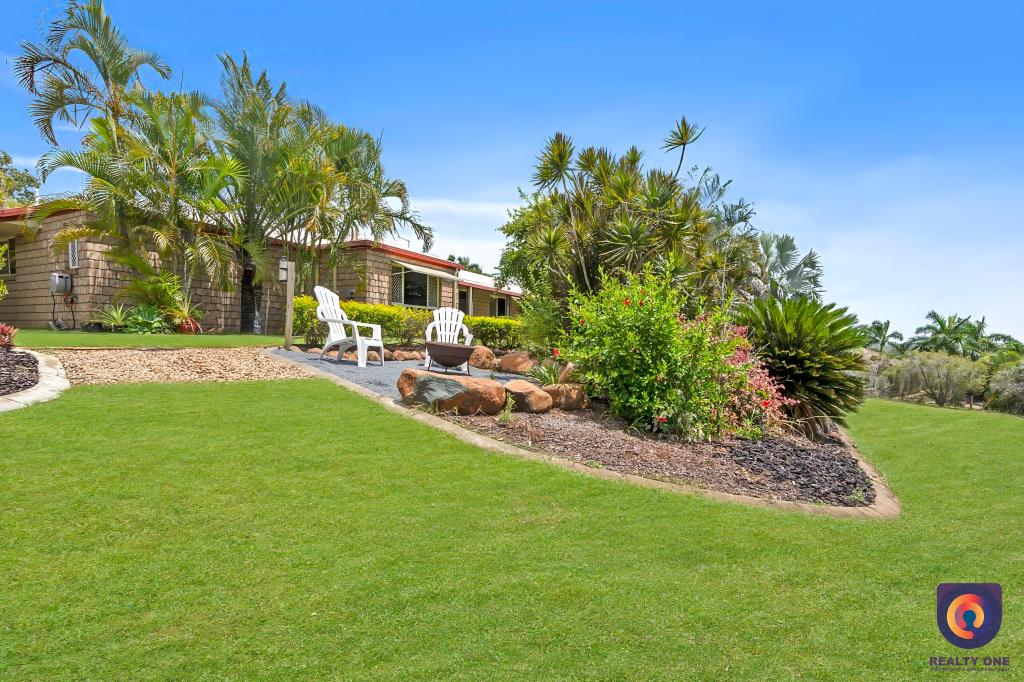 0
0
 0
0
About Glenlee 4711
The size of Glenlee is approximately 42.0 square kilometres. There is 1 park within the area. The population of Glenlee in 2016 was 1236 people. By 2021 the population was 1193 showing a population decline of 3.5% in the area during that time. The predominant age group in Glenlee is 10-19 years. Households in Glenlee are primarily couples with children and are likely to be repaying $1800 - $2399 per month on mortgage repayments. In general, people in Glenlee work in a trades occupation.In 2021, 93.40% of the homes in Glenlee were owner-occupied compared with 93.60% in 2016.
Glenlee has 453 properties. Over the last 5 years, Houses in Glenlee have seen a 89.31% increase in median value. As at 30 June 2026:
- The median value for Houses in Glenlee is $1,038,441 while the median value for Units is $409,614.
Suburb Insights for Glenlee 4711
Market Insights
Glenlee Trends for Houses
N/A
N/A
View TrendN/A
N/A
Glenlee Trends for Units
N/A
N/A
View TrendN/A
N/A
Neighbourhood Insights
© Copyright 2026. RP Data Pty Ltd trading as Cotality (Cotality). All rights reserved. No reproduction, distribution, or transmission of the copyrighted materials is permitted. The information is deemed reliable but not guaranteed.
While Cotality uses commercially reasonable efforts to ensure the Cotality Data is current, Cotality does not warrant the accuracy, currency or completeness of the Cotality Data and to the full extent permitted by law excludes all loss or damage howsoever arising (including through negligence) in connection with the Cotality Data.
This product uses cookies and other similar technologies to improve and customise your browsing experience, to tailor content and adverts, and for analytics and metrics regarding visitor usage on this product and other media. We may share cookie and analytics information with third parties for the purposes of advertising. By continuing to use our website, you consent to cookies being used. View our Privacy Policy here.
X