
1 Fraser CourtDysart QLD 4745
Property Details for 1 Fraser Ct, Dysart
1 Fraser Ct, Dysart is a 4 bedroom, 1 bathroom House with 1 parking spaces and was built in 1996. The property has a land size of 871m2 and floor size of 86m2. While the property is not currently for sale or for rent, it was last sold in September 2016.
Last Listing description (March 2026)
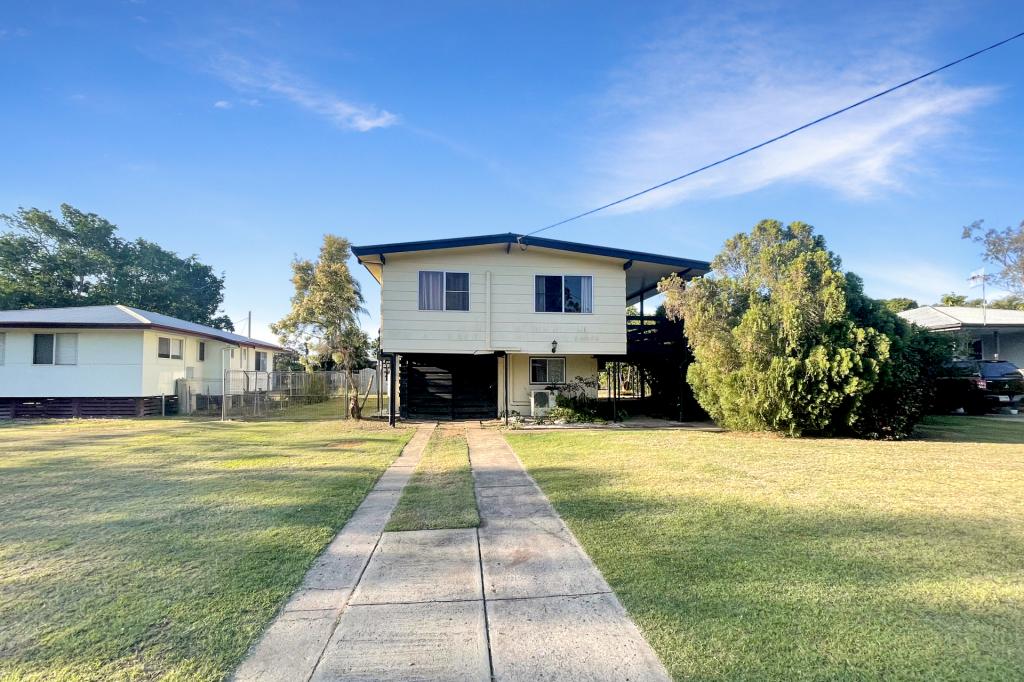
This split level family home is on a large block located a short drive from the township! The home has 4 good size bedrooms and an open plan living area, a large kitchen, a separate bathroom and toilet. Air conditioning throughout , Huge back deck perfect for entertaining, overlooking the backyard!
Enclosed underneath with laundry, a large area perfect for a vehicle and storage area.
Rent will increase to $550 per week from the 25/06/2026
Book an inspection online today
To apply for this available rental please head to: https://2apply.com.au/agency?n=lhmackay&form=0 or alternatively, please phone our office on 07 4962 3535.
Disclaimer:
The Agent does not give any warranty as to errors or omissions, if any, in these particulars, the provided information from the Vendor can be deemed reliable but not accurate. Any persons interested in the property should conduct their own research.
Property History for 1 Fraser Ct, Dysart, QLD 4745
- 16 Mar 2026Listed for Rent $520 / week
- 27 Jan 2022Listed for Rent $350 / week
- 05 Sep 2016Sold for $99,000

Recent sales nearby
See more recent sales nearbySimilar properties For Sale nearby
See more properties for sale nearby
 0
0 0
0 0
0Similar properties For Rent nearby
See more properties for rent nearby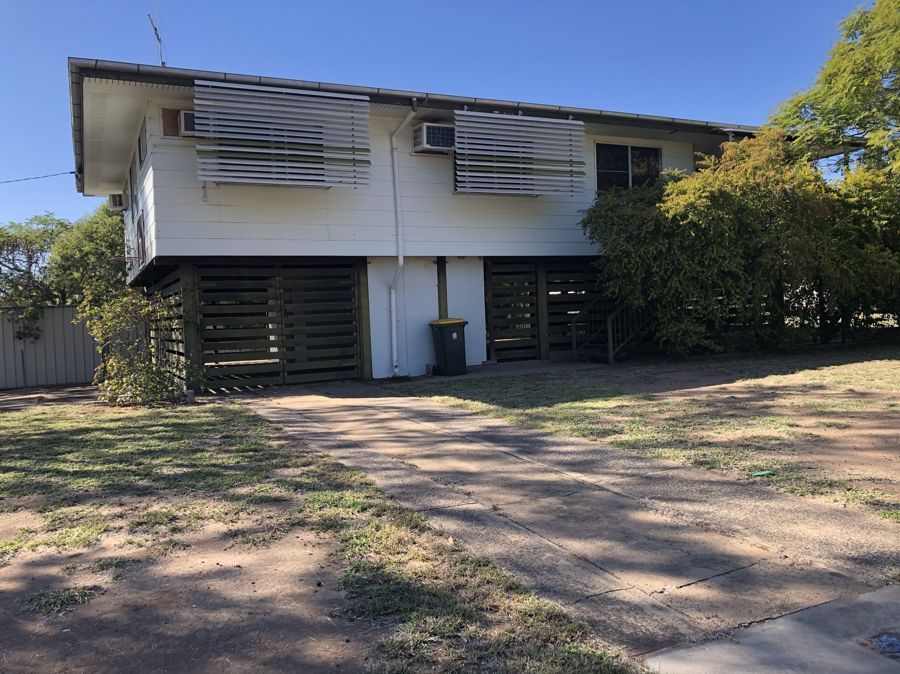 0
0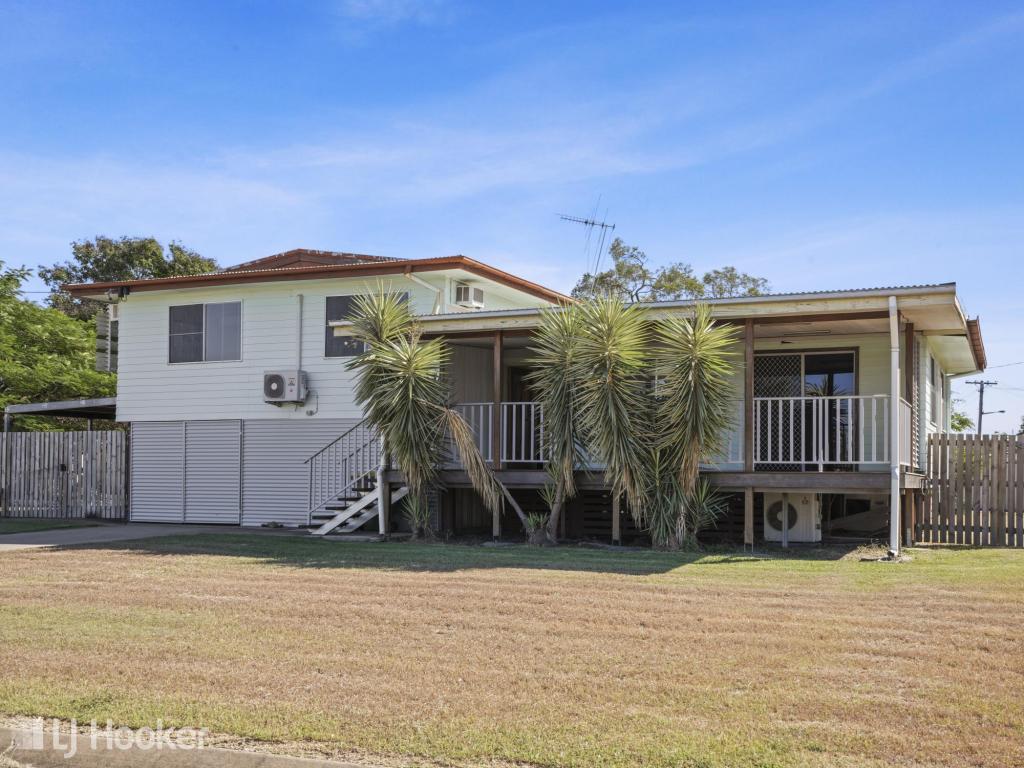 0
0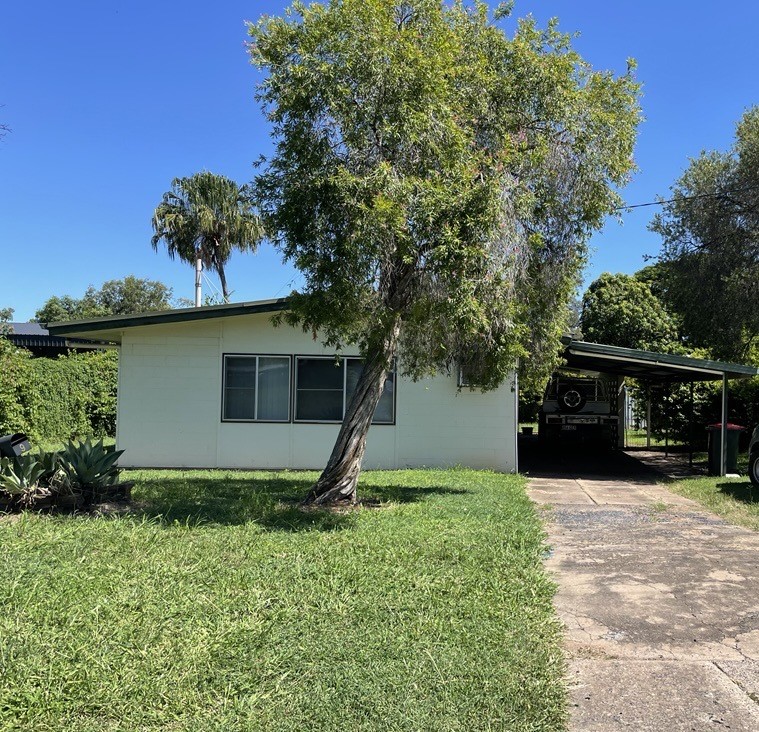 0
0About Dysart 4745
The size of Dysart is approximately 3460.0 square kilometres. It has 17 parks covering nearly 2.5% of total area. The population of Dysart in 2016 was 2991 people. By 2021 the population was 2918 showing a population decline of 2.4% in the area during that time. The predominant age group in Dysart is 30-39 years. Households in Dysart are primarily couples with children and are likely to be repaying $600 - $799 per month on mortgage repayments. In general, people in Dysart work in a machinery operators and drivers occupation.In 2021, 33.40% of the homes in Dysart were owner-occupied compared with 28.30% in 2016.
Dysart has 1,616 properties. Over the last 5 years, Houses in Dysart have seen a 69.31% increase in median value, while Units have seen a 19.92% increase. As at 28 February 2026:
- The median value for Houses in Dysart is $237,944 while the median value for Units is $363,055.
- Houses have a median rent of $450 while Units have a median rent of $400.
Suburb Insights for Dysart 4745
Market Insights
Dysart Trends for Houses
N/A
N/A
View TrendN/A
N/A
Dysart Trends for Units
N/A
N/A
View TrendN/A
N/A
Neighbourhood Insights
© Copyright 2026. RP Data Pty Ltd trading as Cotality (Cotality). All rights reserved. No reproduction, distribution, or transmission of the copyrighted materials is permitted. The information is deemed reliable but not guaranteed.
While Cotality uses commercially reasonable efforts to ensure the Cotality Data is current, Cotality does not warrant the accuracy, currency or completeness of the Cotality Data and to the full extent permitted by law excludes all loss or damage howsoever arising (including through negligence) in connection with the Cotality Data.
This product uses cookies and other similar technologies to improve and customise your browsing experience, to tailor content and adverts, and for analytics and metrics regarding visitor usage on this product and other media. We may share cookie and analytics information with third parties for the purposes of advertising. By continuing to use our website, you consent to cookies being used. View our Privacy Policy here.
X