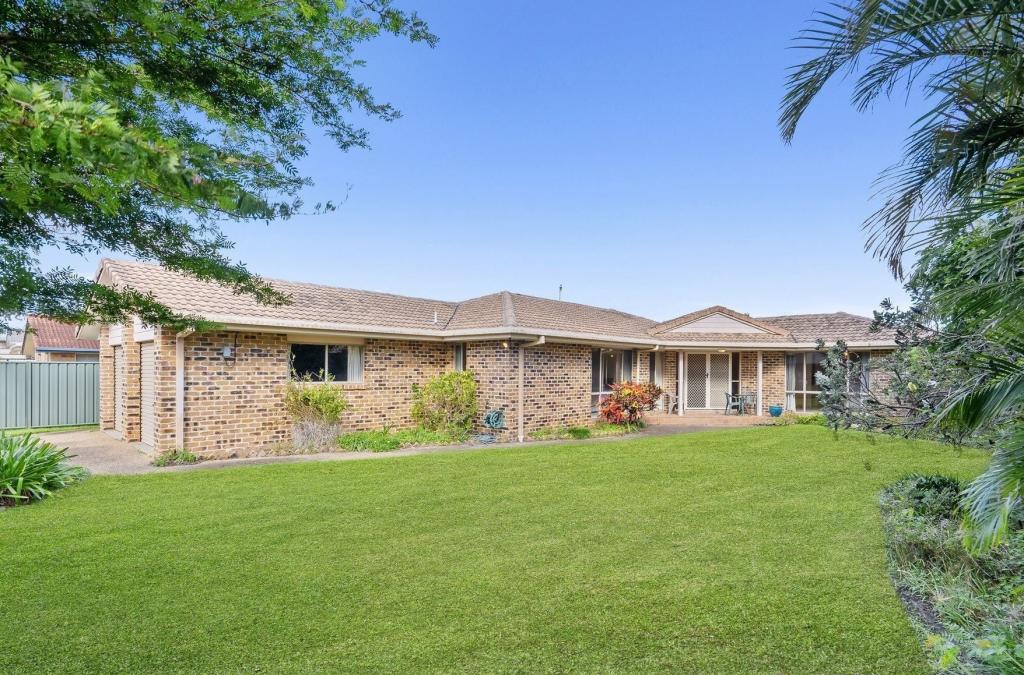
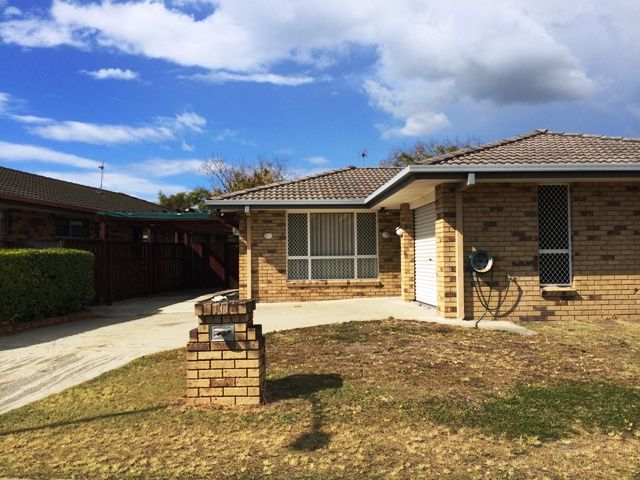
9 Wagtail Court, Burleigh Waters, QLD 4220 | Property Value & History | OnTheHouse
OFF MARKET
Are you the owner?

9 Wagtail Court
Burleigh Waters QLD 4220

Bedrooms: -
Bathrooms: -
Car spaces: -
Land area: 605m2
We do not have enough data to display the calculated estimate for this property.
Save

Property Details for 9 Wagtail Ct, Burleigh Waters

9 Wagtail Ct, Burleigh Waters is a bedroom, bathroom Unit and was built in 1986. The property has a land size of 605m2.

Building Type
Unit
Year Built
1986
Land Size
605m2
Local Government
Gold Coast City
Lot/Plan
1/BUP6070

Property History for 9 Wagtail Ct, Burleigh Waters, QLD 4220

A timeline of how this property has performed in the market
    No history found for this property.

Commute Calculator

Where to?
-
-
-
-

About Burleigh Waters 4220

The size of Burleigh Waters is approximately 6.7 square kilometres. It has 21 parks covering nearly 5.9% of total area. The population of Burleigh Waters in 2016 was 14310 people. By 2021 the population was 14556 showing a population growth of 1.7% in the area during that time. The predominant age group in Burleigh Waters is 40-49 years. Households in Burleigh Waters are primarily couples with children and are likely to be repaying $1800 - $2399 per month on mortgage repayments. In general, people in Burleigh Waters work in a professional occupation.In 2021, 77.60% of the homes in Burleigh Waters were owner-occupied compared with 73.70% in 2016..

Burleigh Waters has 6,505 properties. Over the last 5 years, Houses in Burleigh Waters have seen a 102.53% increase in median value, while Units have seen a 107.65% increase. As at 30 June 2025:

  • The median value for Houses in Burleigh Waters is $1,777,134 while the median value for Units is $872,659.
  • Houses have a median rent of $1,000 while Units have a median rent of $850.
There are currently 44 properties listed for sale, and 16 properties listed for rent in Burleigh waters on OnTheHouse. According to CoreLogic's data, 343 properties were sold in the past 12 months in Burleigh waters.

What's around 9 Wagtail Ct, Burleigh Waters

9 Wagtail Ct, Burleigh Waters is in the school catchment zone for Caningeraba State School and Miami State High School.

Nearby Schools
Comparable Properties
Caningeraba State School
0.4km
Burleigh Waters 4220
IN CATCHMENTPrimaryGovernmentP - 6Combined1026 Enrolled
Burleigh Heads State School
1.39km
Burleigh Heads 4220
PrimaryGovernmentP - 6Combined516 Enrolled
Marymount College
1.71km
Burleigh Waters 4220
SecondaryNon-Government7 - 12Combined1221 Enrolled
Marymount Primary School
1.78km
Burleigh Waters 4220
PrimaryNon-GovernmentP - 6Combined1003 Enrolled
Varsity College
2.4km
Varsity Lakes 4227
CombinedGovernmentP - 12Combined3223 Enrolled
Miami State High School
2.53km
Address not found
IN CATCHMENTSecondaryGovernment7 - 12Combined1216 Enrolled
Arcadia College
2.62km
Varsity Lakes 4227
SpecialNon-Government7 - 12Combined189 Enrolled
Miami State School
2.92km
Address not found
PrimaryGovernmentP - 6Combined819 Enrolled
Robina State School
3.74km
Robina 4226
PrimaryGovernmentP - 6Combined802 Enrolled
Palm Beach State School
3.82km
Palm Beach 4221
PrimaryGovernmentP - 6Combined511 Enrolled

Suburb Insights for Burleigh Waters 4220

Market Insights
Burleigh Waters Trends for Houses
Median Value

$1.78M

4.56%
View Trend
Median Growth

5.53%

View Trend
Median Rent

$1.00k/W

1.01%
View Trend
Rental Yield

3.62%

8.59%
View Trend
Median Value: The middle value of all properties across the geography based on the Automated Valuation Model.


Median Value over 1 year (07/24 - 06/25)
Burleigh Waters Trends for Units
Median Value

$873k

2.55%
View Trend
Median Growth

6.47%

View Trend
Median Rent

$850/W

8.97%
View Trend
Rental Yield

4.98%

7.09%
View Trend
Median Value: The middle value of all properties across the geography based on the Automated Valuation Model.


Median Value over 1 year (07/24 - 06/25)
Neighbourhood Insights
Age

Population 14,556

0-9


12%

10-19


12%

20-29


10%

30-39


13%

40-49


15%

50-59


12%

60-69


11%

70-79


10%

80-89


5%

90-99


1%

Household Structure
Occupancy
CoreLogic Copyright and Legal Disclaimers about Property Data
Disclaimer
Whilst all reasonable effort is made to ensure the information in this publication is current, CoreLogic does not warrant the accuracy or completeness of the data and information contained in this publication and to the full extent not prohibited by law excludes all liability for any loss or damage arising in connection with the data and information contained in this publication.
Queensland data
Based on or contains data provided by the State of Queensland (Department of Resources) 2025. In consideration of the State permitting use of this data you acknowledge and agree that the State gives no warranty in relation to the data (including accuracy, reliability, completeness, currency or suitability) and accepts no liability (including without limitation, liability in negligence) for any loss, damage or costs (including consequential damage) relating to any use of the data. Data must not be used for direct marketing or be used in breach of the privacy laws; more information at www.propertydatacodeofconduct.com.au
Valuations and Estimates
This estimate is provided by CoreLogic, and is based on statistical market data such as recent local sales, property size, number of bedrooms and many more factors. It comes from public data, which may be incomplete or inaccurate, and should not be used in lieu of a professional appraisal under any circumstances, including for lending purposes or in home loan applications.
School data and Content
Product Data licenced by CoreLogic under a Creative Commons Attribution licence. For details regarding licence, data source, copyright and disclaimers, see https://www.corelogic.com.au/legals/third-party-restrictions
ABS data
This publication contains data and statistics provided by the Australian Bureau of Statistics, available at http://www.abs.gov.au/ and reproduced under Creative Commons Attribution 2.5 http://creativecommons.org/licenses/by/2.5/au/legalcode
Liveability information
The Liveability Score is a rating (out of 10) provided by Propella.ai Pty Ltd as a guide about how "well-connected" properties are in certain local areas. The Liveability Score is based on statistical data about a local area in which a property is located including the distance to and number of available facilities and services (including schools, parklands, health services, shopping and public transport) (Liveability Data). The Liveability Data and Liveability Score has not been verified or confirmed by CoreLogic, is not available for all properties, and is of a general nature and should not be construed as specific advice or relied upon in lieu of appropriate professional advice. Given the relative nature of the Liveability Score, propella.ai anticipate that scores for individual properties will change over time.
BESbswy