28 Greg Chappell DriveBurleigh Heads QLD 4220
Property Details for 28 Greg Chappell Dr, Burleigh Heads
Last Listing description (December 2024)
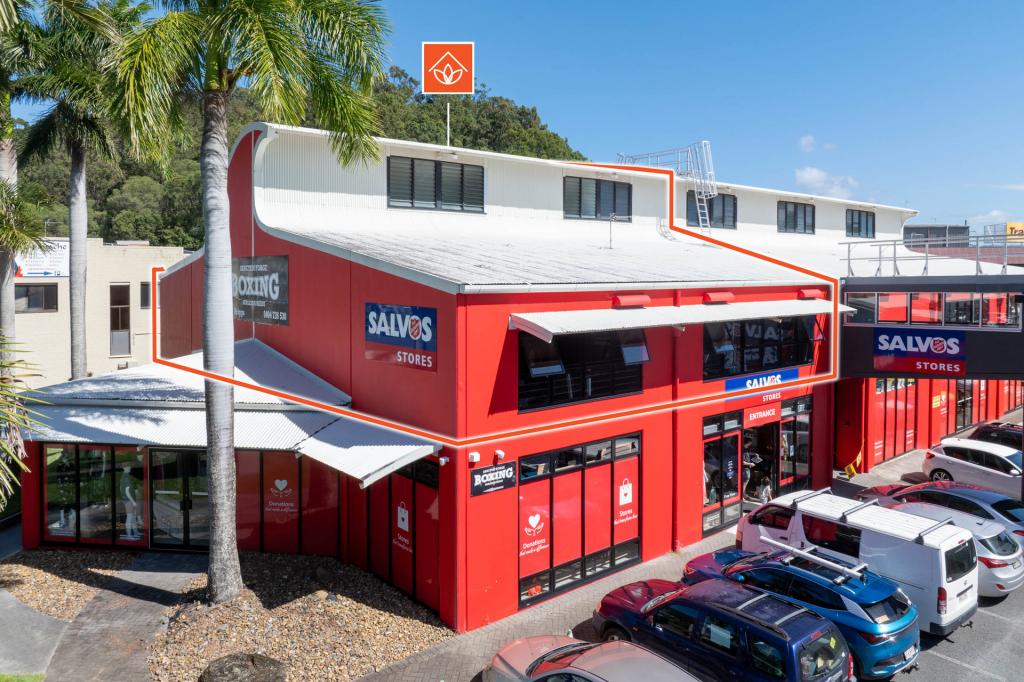
Peter Laoudikos & Lachlan Holliday offer this exceptional Burleigh Heads investment to the market with serious rental and development upside. The property is a multi-tenanted, industrial, freehold asset strategically positioned in Queensland's premier Industrial suburb. Zoned High Impact Industry and providing an average rental rate of $192* per m, there is some serious upside in this property with leases renewals and rent reviews coming in 2024 & 2025.
The property offers the below rarely offered attributes;
Gross income $218,209.72* with unit 3 currently vacant
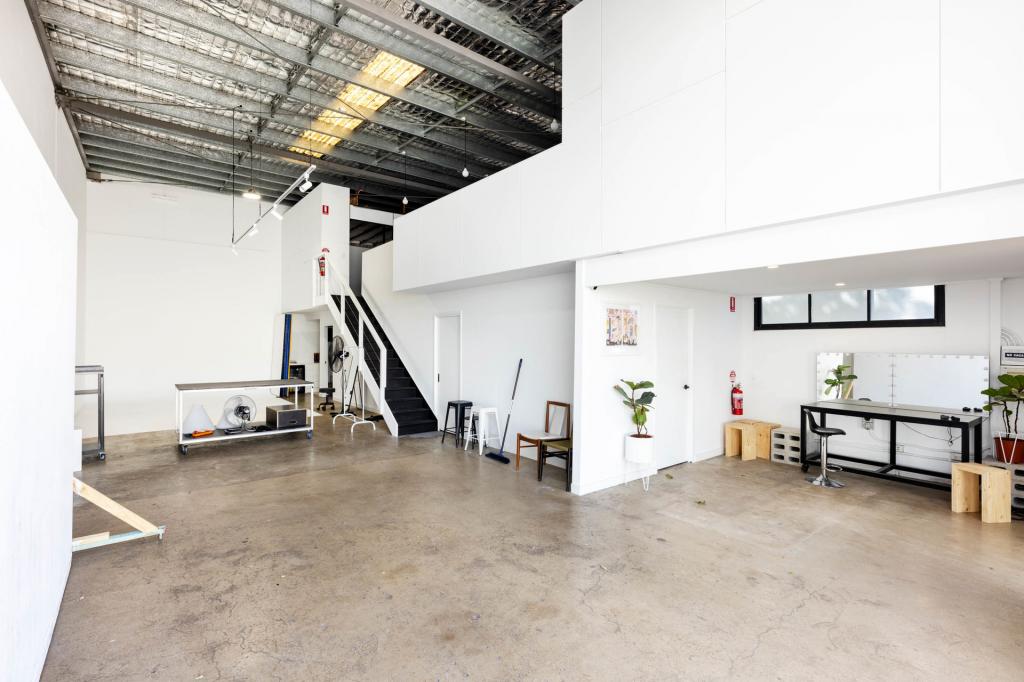
Net lettable area 1,131m*
Substantial 2,429m* land holding with highly favourable `High Impact Industry' zoning
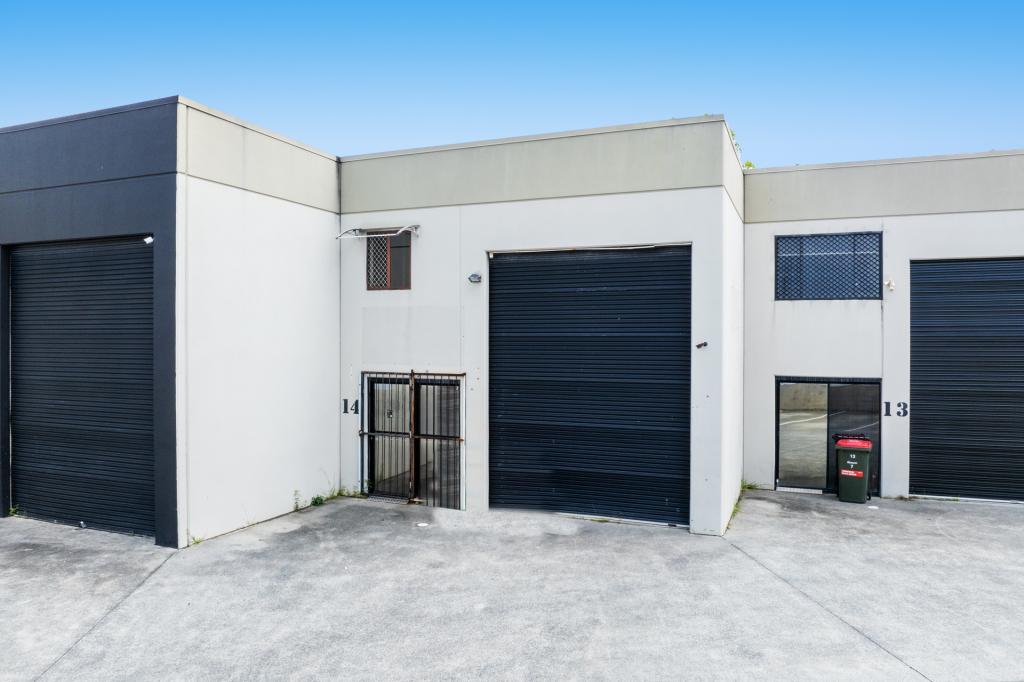
7 Individual tenancies with one vacancy provides immediate rental upside or owner possession
Ability to increase net lettable area with additional mezzanines
A mix of long standing tenants and new
Extremely low vacancy rates in suburb
Above average carpark ratio
New roof installation
Low maintenance complex
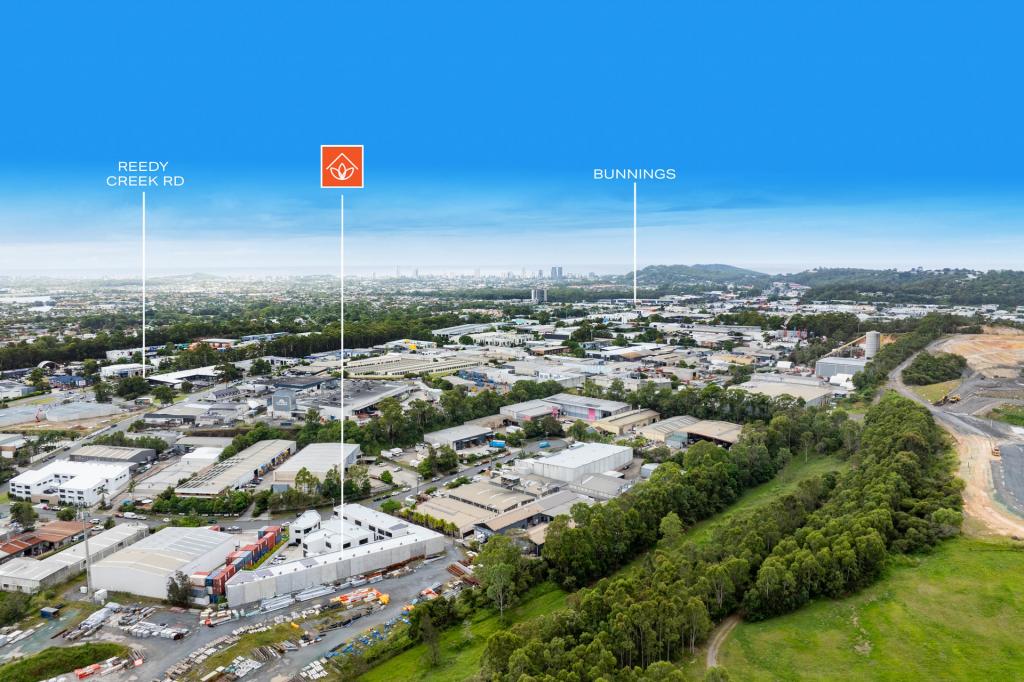
Surrounded by National and Multi-national businesses within one of the Gold Coast's & Queensland's most sort after Commercial & Industrial estates
The property can be accessed from Reedy Creek Road, which connects to Bermuda Street and the M1 Pacific Motorway
* Approx.
Disclaimer:
RWC has not independently checked any of the information we merely pass on. We make no comment on and give no warranty as to the accuracy of the information contained in this document which does not constitute all or any part of any offer or contract by the recipient. Prospective purchasers / lessees must rely on their own enquiries and should satisfy themselves as to the truth or accuracy of all information given by their own inspections, searches, inquiries, advice or as is otherwise necessary. No duty of care is assumed by RWC divisions toward the recipient with regard to the use of this information and all information given is given without responsibility.
Property History for 28 Greg Chappell Dr, Burleigh Heads, QLD 4220
- 06 Aug 2024Listed for Sale Sale by Negotiation
- 03 Mar 2022Listed for Rent - Price not available
- 27 Sep 2021Listed for Sale Auction
Recent sales nearby
See more recent sales nearbySimilar properties For Sale nearby
See more properties for sale nearby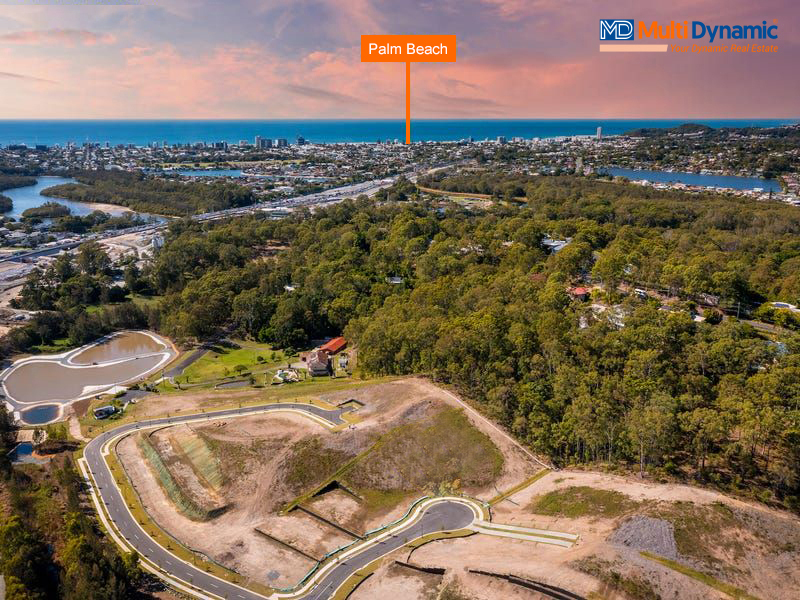
Similar properties For Rent nearby
See more properties for rent nearby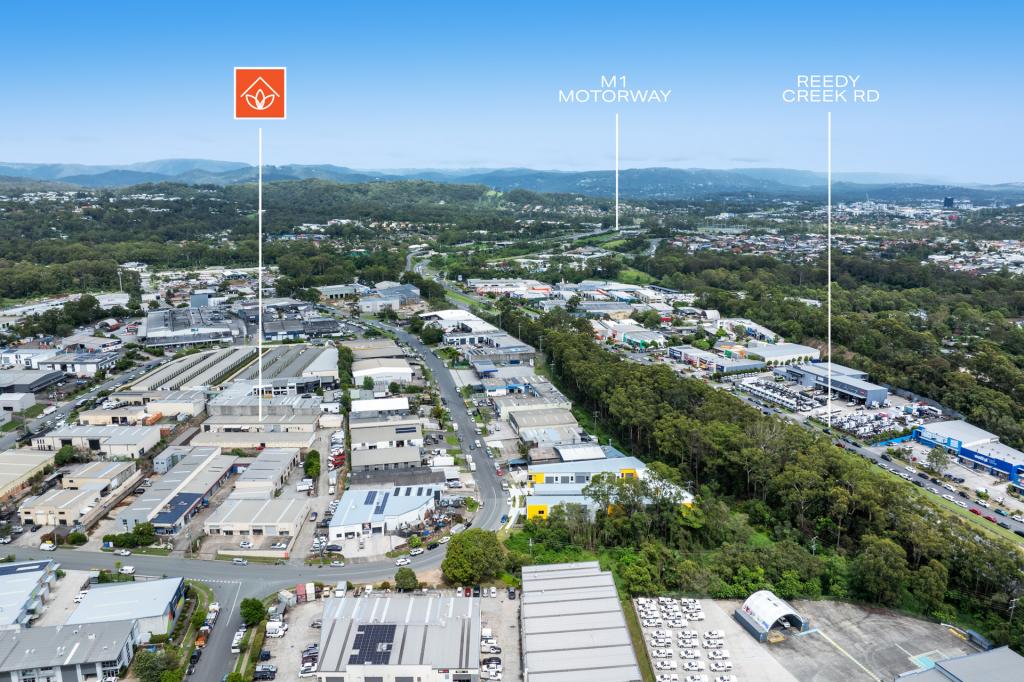
About Burleigh Heads 4220
The size of Burleigh Heads is approximately 10.2 square kilometres. It has 23 parks covering nearly 16% of total area. The population of Burleigh Heads in 2011 was 9,186 people. By 2016 the population was 10,063 showing a population growth of 9.5% in the area during that time. The predominant age group in Burleigh Heads is 30-39 years. Households in Burleigh Heads are primarily childless couples and are likely to be repaying $1800 - $2399 per month on mortgage repayments. In general, people in Burleigh Heads work in a professional occupation. In 2011, 59.3% of the homes in Burleigh Heads were owner-occupied compared with 60.2% in 2016.
Burleigh Heads has 9,362 properties. Over the last 5 years, Houses in Burleigh Heads have seen a 87.07% increase in median value, while Units have seen a 106.27% increase. As at 30 April 2025:
- The median value for Houses in Burleigh Heads is $1,701,156 while the median value for Units is $1,177,049.
- Houses have a median rent of $910 while Units have a median rent of $810.
What's around 28 Greg Chappell Dr, Burleigh Heads
28 Greg Chappell Dr, Burleigh Heads is in the school catchment zone for Varsity College.


Suburb Insights for Burleigh Heads 4220
Market Insights
Burleigh Heads Trends for Houses
$1.70M
2.26%
View Trend$910/W
3.62%
Burleigh Heads Trends for Units
$1.18M
7.17%
View Trend$810/W
3.75%
Neighbourhood Insights
Age
Population 10,063
0-9
10%
10-19
8%
20-29
15%
30-39
15%
40-49
13%
50-59
12%
60-69
13%
70-79
8%
80-89
4%
90-99
1%
Household Structure
Occupancy
© Copyright 2025 RP Data Pty Ltd trading as CoreLogic Asia Pacific (CoreLogic). All rights reserved.
This product uses cookies and other similar technologies to improve and customise your browsing experience, to tailor content and adverts, and for analytics and metrics regarding visitor usage on this product and other media. We may share cookie and analytics information with third parties for the purposes of advertising. By continuing to use our website, you consent to cookies being used. View our Privacy Policy here.
X