
3 Maynard DriveBunya QLD 4055
Property Details for 3 Maynard Dr, Bunya
3 Maynard Dr, Bunya is a 5 bedroom, 2 bathroom House with 4 parking spaces and was built in 1990. The property has a land size of 6000m2 and floor size of 240m2. While the property is not currently for sale or for rent, it was last sold in September 2009.
Last Listing description (October 2009)
"HILLVIEW" A FAMILY HAVEN
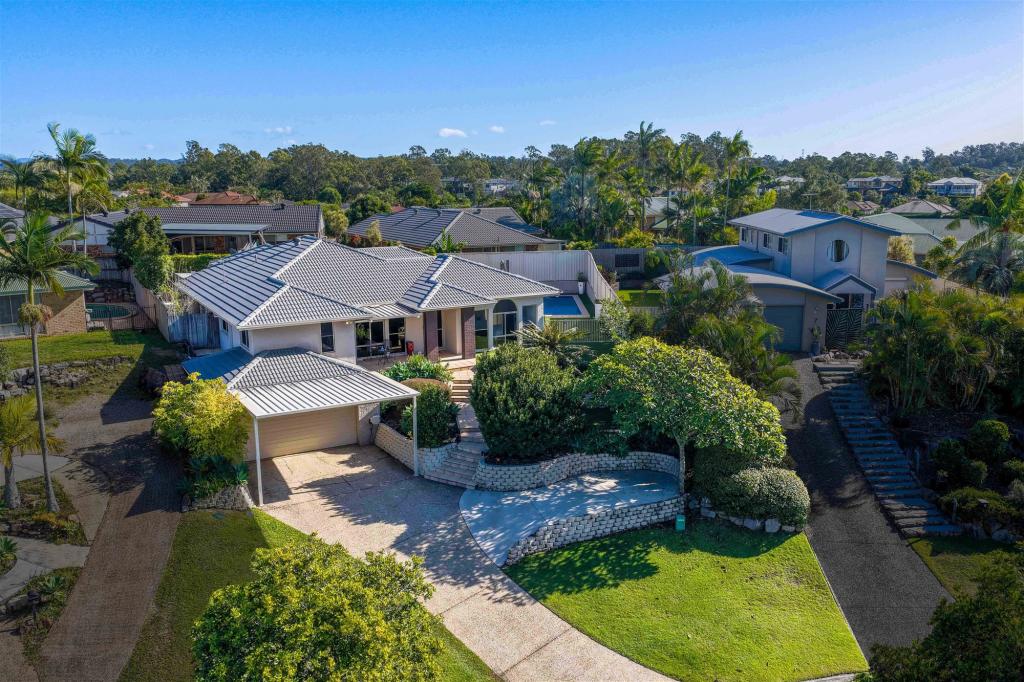
A DREAM FAMILY HOME LOVINGLY DEVELOPED AND MAINTAINED ON 6000SQM OFFERING SPRAWLING RURAL LIVING AND ONLY 25MINS FROM THE CBD.
BEAUTIFULLY PRESENTED THE EXPANSIVE LOW SET BRICK HOME BOASTS GENEROUS LIVING SPACES THROUGHOUT INCLUDING FORMAL LIVING AND FAMILY MEALS AREA ALONG WITH DOUBLE SIZED BEDROOMS, A MEDIA ROOM, SEPARATE STUDY AND A HUGE OUTDOOR ENTERTAINING PAVILION PLUS A GAZEBO OVERLOOKING THE ROLLING GREEN LAWNS SURROUNDING THE PROPERTY.
ADDITIONAL FEATURES OF THIS OUTSTANDING HOME ARE LISTED BELOW:
- FORMAL LOUNGE
- MEDIA ROOM
- FAMILY ROOM
- MUSIC ROOM
- STUDY
- 9" CEILINGS
- FULLY AIR CONDITIONED
- SECURITY GRILLS / SCREENS
- FRESHLY PAINTED
- NEW CARPET
- NEW STONE BENCHTOPS TO THE KITCHEN AND ENSUITE
- 9M X 6M COLOURBOND GARAGE PLUS 3M X 3M GARDEN SHED
- PROFESSIONAL QUALITY (REMOVABLE) BASKETBALL / NETBALL BACKBOARD AND HOOPS, GOLF HOLE AND AFL GOAL POSTS (ALL REMOVABLE)
- FULLY FENCED WITH KOPPER LOGS AND DOG WIRE
- 3 PEDESTRIAN GATES, 1 CAR ACCESS GATE AND AUTOMATIC / REMOTE MAIN ACCESS GATE AT DRIVEWAY
- FULLY LANDSCAPED WITH MATURE TREES (INCL A NUT BEARING MACADAMIA)
- JOHN DEERE 110L LAWN TRACTOR INCLUDED!
Property History for 3 Maynard Dr, Bunya, QLD 4055
- 26 Nov 2010Listed for Rent - Price not available
- 24 Nov 2009Listed for Rent - Price not available
- 09 Sep 2009Sold for $842,000

Recent sales nearby
See more recent sales nearbySimilar properties For Sale nearby
See more properties for sale nearby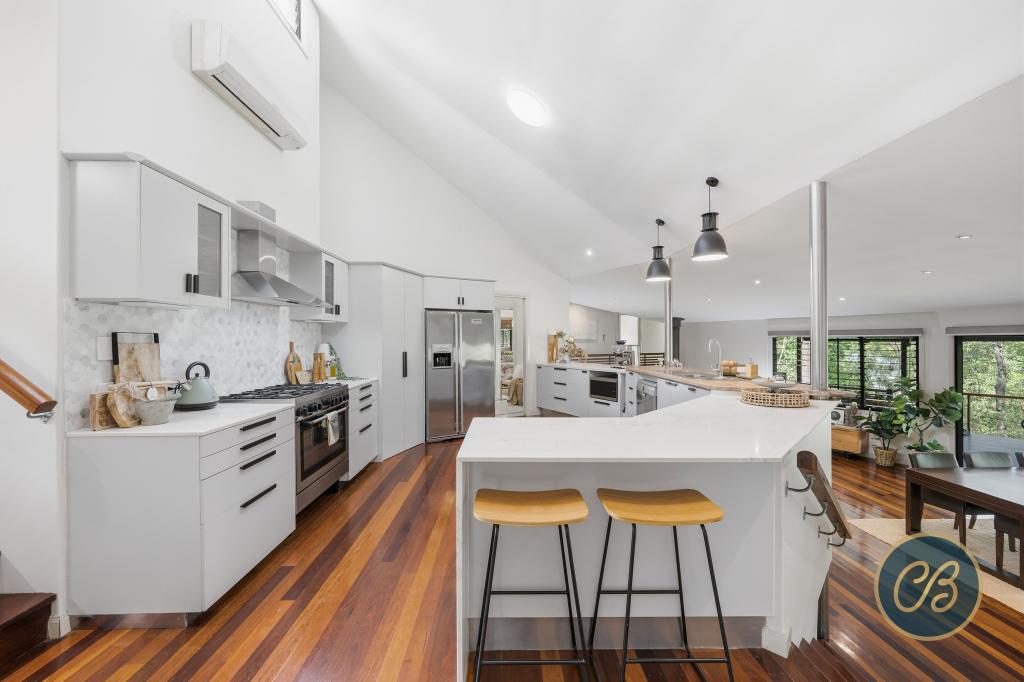 0
0
 0
0Similar properties For Rent nearby
See more properties for rent nearby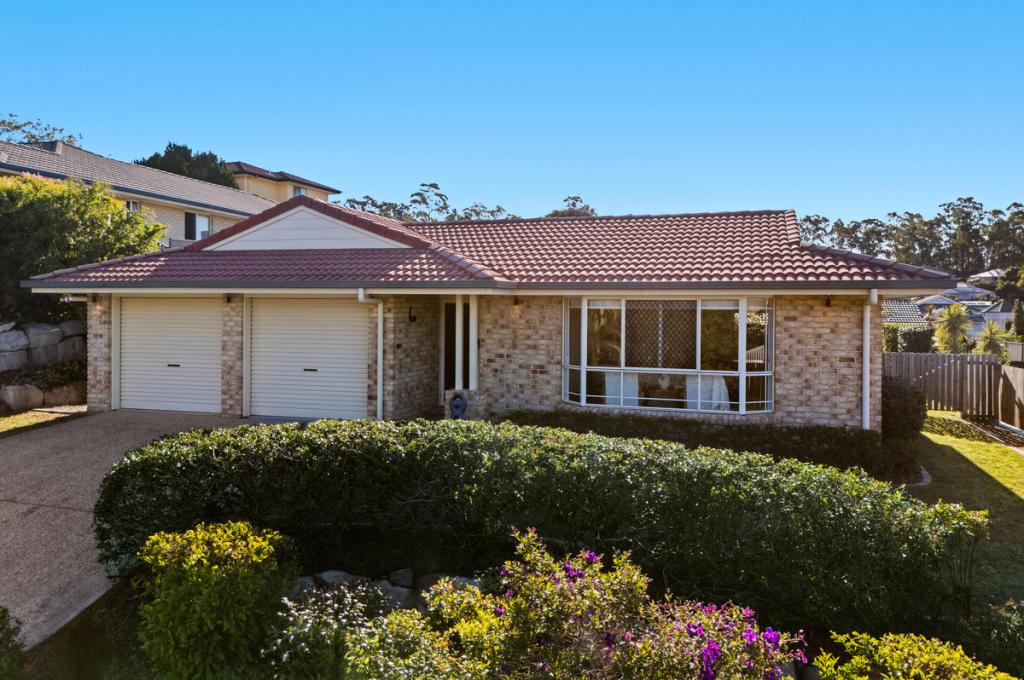 0
0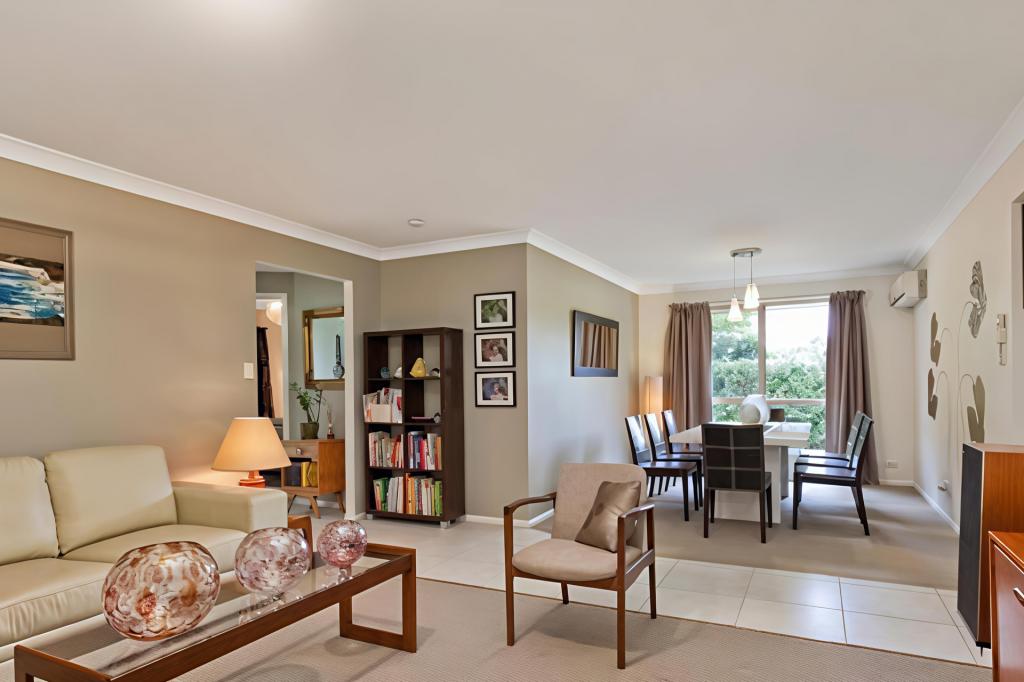 0
0About Bunya 4055
The size of Bunya is approximately 14.5 square kilometres. There are 17 parks, covering nearly 54.3% of the total area. The population of Bunya in 2016 was 1916 people. By 2021 the population was 1968 showing a population growth of 2.7% in the area during that time. The predominant age group in Bunya is 50-59 years. Households in Bunya are primarily couples with children and are likely to be repaying $3000 - $3999 per month on mortgage repayments. In general, people in Bunya work in a professional occupation.In 2021, 96.00% of the homes in Bunya were owner-occupied compared with 95.80% in 2016.
Bunya has 686 properties. Over the last 5 years, Houses in Bunya have seen a 76.39% increase in median value, while Units have seen a 83.37% increase. As at 30 June 2026:
- The median value for Houses in Bunya is $1,851,504 while the median value for Units is $885,063.
Suburb Insights for Bunya 4055
Market Insights
Bunya Trends for Houses
N/A
N/A
View TrendN/A
N/A
Bunya Trends for Units
N/A
N/A
View TrendN/A
N/A
Neighbourhood Insights
© Copyright 2026. RP Data Pty Ltd trading as Cotality (Cotality). All rights reserved. No reproduction, distribution, or transmission of the copyrighted materials is permitted. The information is deemed reliable but not guaranteed.
While Cotality uses commercially reasonable efforts to ensure the Cotality Data is current, Cotality does not warrant the accuracy, currency or completeness of the Cotality Data and to the full extent permitted by law excludes all loss or damage howsoever arising (including through negligence) in connection with the Cotality Data.
This product uses cookies and other similar technologies to improve and customise your browsing experience, to tailor content and adverts, and for analytics and metrics regarding visitor usage on this product and other media. We may share cookie and analytics information with third parties for the purposes of advertising. By continuing to use our website, you consent to cookies being used. View our Privacy Policy here.
X