11 Robert StreetBundaberg South QLD 4670
Property Details for 11 Robert St, Bundaberg South
11 Robert St, Bundaberg South is a 8 bedroom, 4 bathroom Unit with 4 parking spaces. The property has a land size of 936m2. While the property is not currently for sale or for rent, it was last sold in June 2021.
Last Listing description (August 2021)
This body corporate free complex of four units is conveniently located within an easy distance to all amenities and the Bundaberg CBD. The brick and tile construction assists in keeping maintenance to a minimum in order to maximize your returns. All units are on fixed term lease agreements and have a combined gross income of approximately $920 per week.
Each unit features:
Two bedrooms - both with built in robes.
Bathroom with separate toilet,
Carport
Ceiling fans through out
Majority of windows and doors have security screens.
Complex features:
No body corporate fees
Brick and tile construction
Concrete Driveway
Fully fenced block
All kitchens replaced in the 10 years.
All units have been upgraded to meet in the incoming legislation for smoke alarms
The complex was also flood free in the 2013 flood event.
Don't miss this opportunity to secure this solid investment property.
Lease information and outgoings are available upon request.
Property 4670 have been provided with the above information; however, the Office and the Agent provides no guarantees, undertakings or warnings concerning the accuracy, completeness or up-to-date nature of the information provided by the Vendor or other Persons. All interested parties are responsible for their own independent inquiries in order to determine whether or not this information is in fact accurate.
Property History for 11 Robert St, Bundaberg South, QLD 4670
- 22 Jun 2021Sold for $640,600
- 08 Jun 2021Listed for Sale UNDER OFFER - SUBJECT TO CONDITIONS
- 07 Jan 2019Listed for Rent $220 / week

Recent sales nearby
See more recent sales nearby

/assets/perm/im3q2n5tiui63h5sn5b3vxygmi?signature=69560ece64e24ea355f98c6572f921c9e71704620a2625cc4c1d06e14eeb55f9) 0
0
/assets/perm/6ltl62zaeui6zaafquqmrhy5ju?signature=b4fac0be61b126aaa9139bf9829dfcde747eb4a1af8509bbb42b984996a1c787) 0
0Similar properties For Sale nearby
See more properties for sale nearby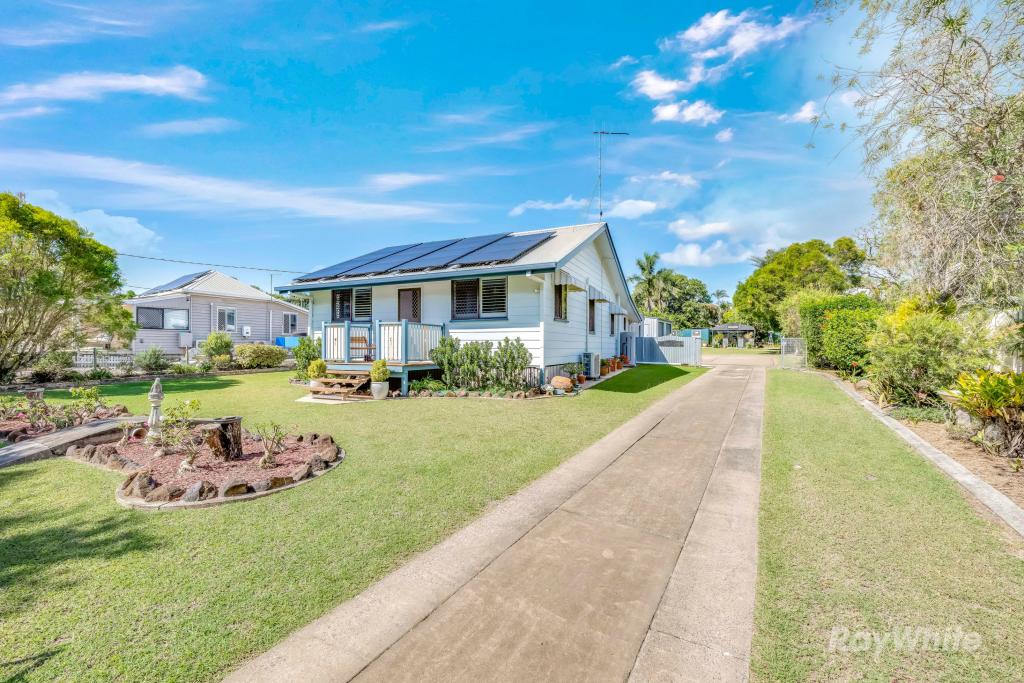 0
0


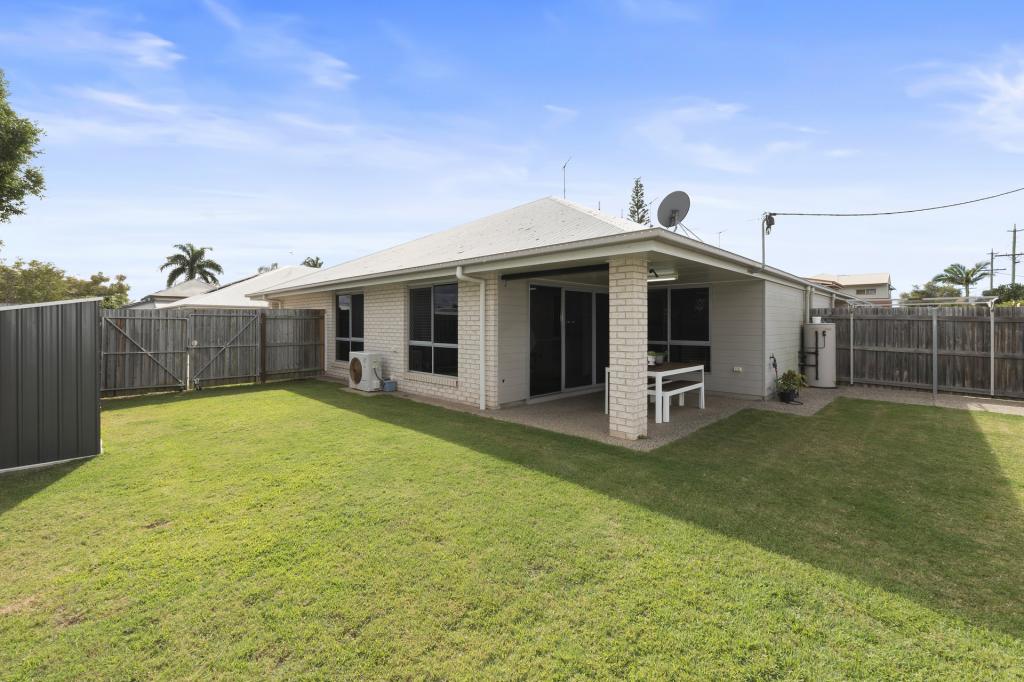 0
0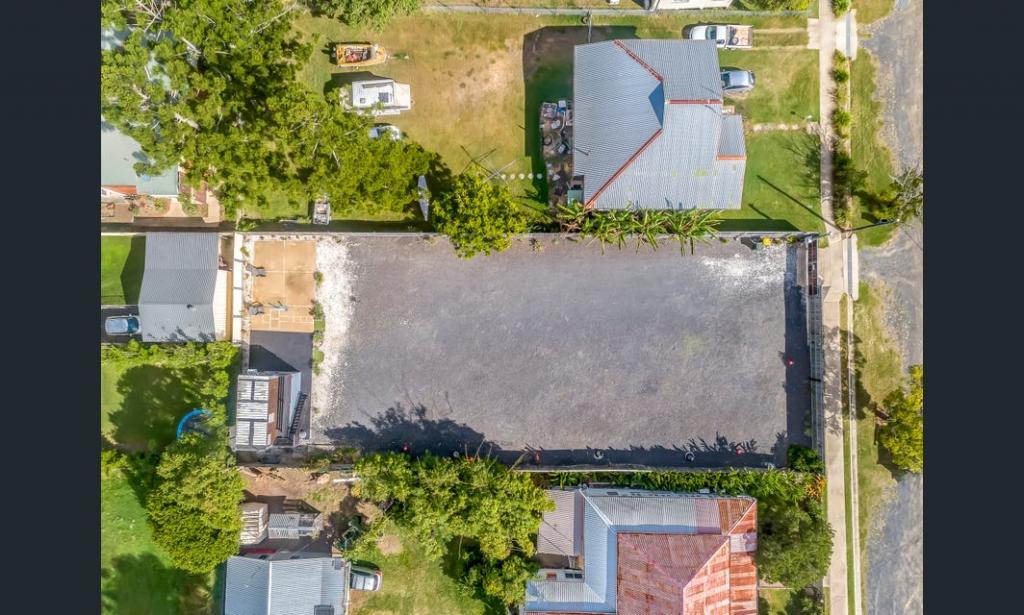 0
0Similar properties For Rent nearby
See more properties for rent nearby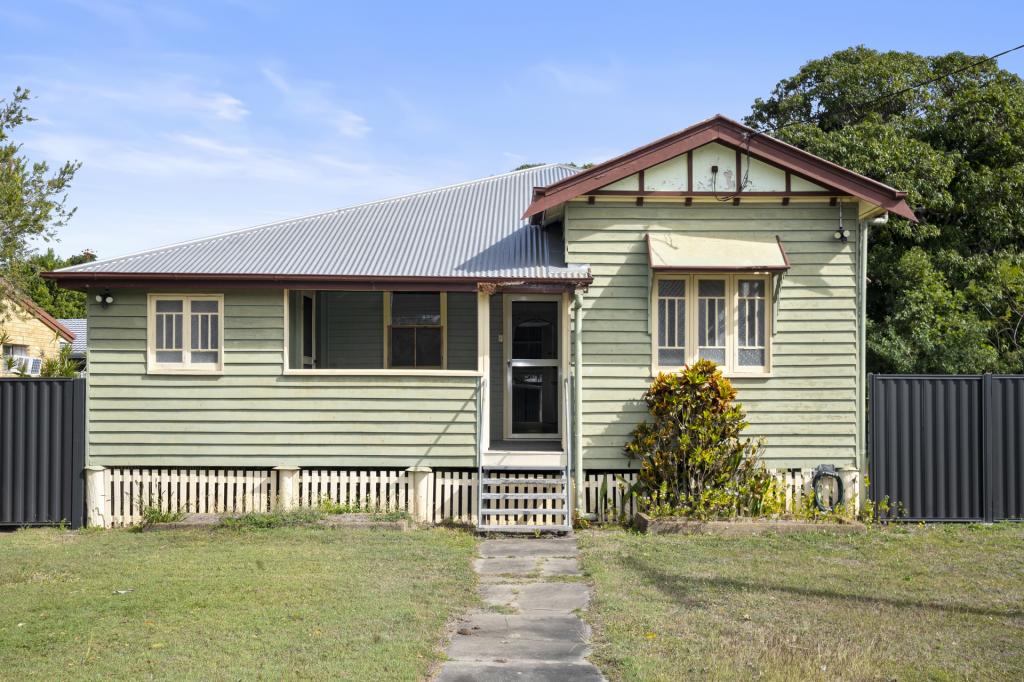 0
0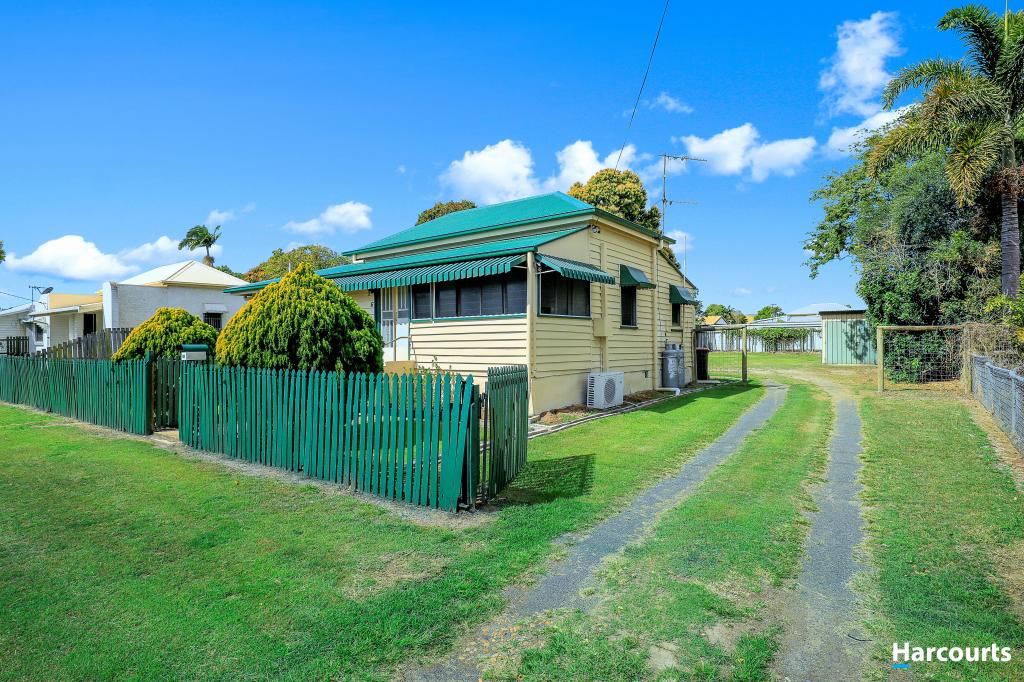 0
0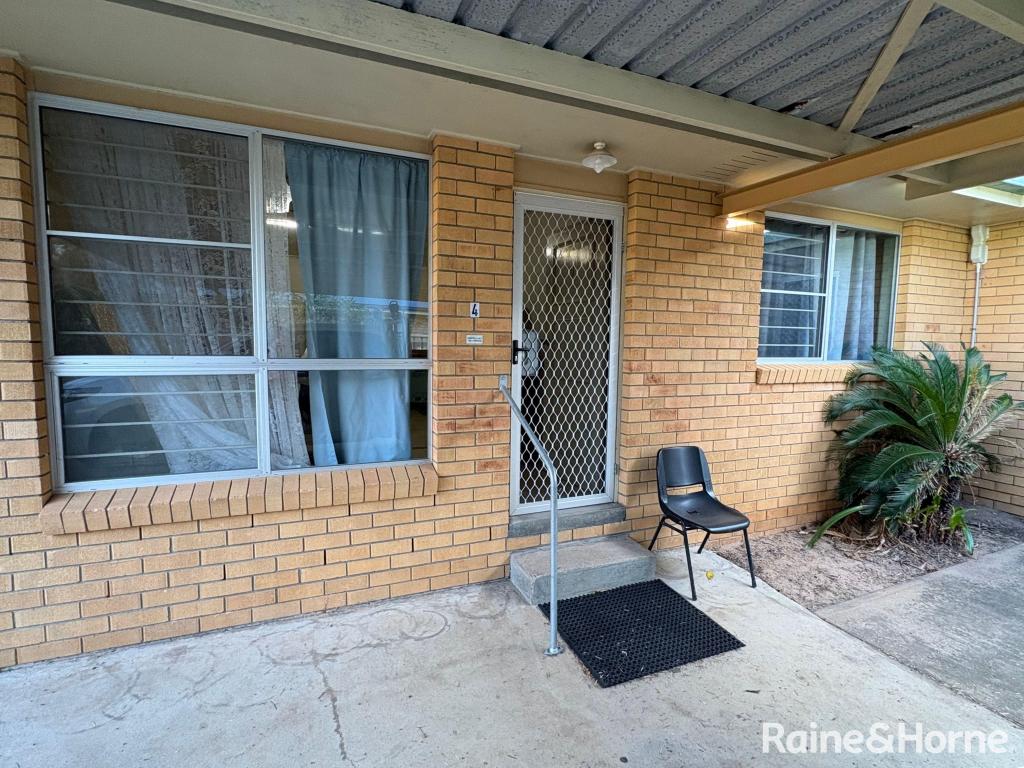 0
0
About Bundaberg South 4670
The size of Bundaberg South is approximately 2.2 square kilometres. There are 10 parks, covering nearly 17.9% of the total area. The population of Bundaberg South in 2016 was 3307 people. By 2021 the population was 3494 showing a population growth of 5.6% in the area during that time. The predominant age group in Bundaberg South is 20-29 years. Households in Bundaberg South are primarily childless couples and are likely to be repaying $1000 - $1399 per month on mortgage repayments. In general, people in Bundaberg South work in a labourer occupation.In 2021, 37.80% of the homes in Bundaberg South were owner-occupied compared with 38.40% in 2016.
Bundaberg South has 1,986 properties. Over the last 5 years, Houses in Bundaberg South have seen a 131.98% increase in median value, while Units have seen a 99.56% increase. As at 31 July 2026:
- The median value for Houses in Bundaberg South is $593,974 while the median value for Units is $474,699.
- Houses have a median rent of $580 while Units have a median rent of $430.
Suburb Insights for Bundaberg South 4670
Market Insights
Bundaberg South Trends for Houses
N/A
N/A
View TrendN/A
N/A
Bundaberg South Trends for Units
N/A
N/A
View TrendN/A
N/A
Neighbourhood Insights
© Copyright 2026. RP Data Pty Ltd trading as Cotality (Cotality). All rights reserved. No reproduction, distribution, or transmission of the copyrighted materials is permitted. The information is deemed reliable but not guaranteed.
While Cotality uses commercially reasonable efforts to ensure the Cotality Data is current, Cotality does not warrant the accuracy, currency or completeness of the Cotality Data and to the full extent permitted by law excludes all loss or damage howsoever arising (including through negligence) in connection with the Cotality Data.
This product uses cookies and other similar technologies to improve and customise your browsing experience, to tailor content and adverts, and for analytics and metrics regarding visitor usage on this product and other media. We may share cookie and analytics information with third parties for the purposes of advertising. By continuing to use our website, you consent to cookies being used. View our Privacy Policy here.
X