
19/3 Ann StreetBundaberg East QLD 4670
Property Details for 19/3 Ann St, Bundaberg East
19/3 Ann St, Bundaberg East is a 3 bedroom, 2 bathroom Townhouse with 1 parking spaces and was built in 2008. The property has a land size of 165m2 and floor size of 119m2. While the property is not currently for sale or for rent, it was last sold in February 2022.
Last Listing description (August 2024)
See below what this townhouse has to offer.
Large main bedroom with its own walk in robe aircon and ensuite.
2 bedrooms both with ceiling fans and built in robes.
Separate toilet downstairs with aircon in the main living area.
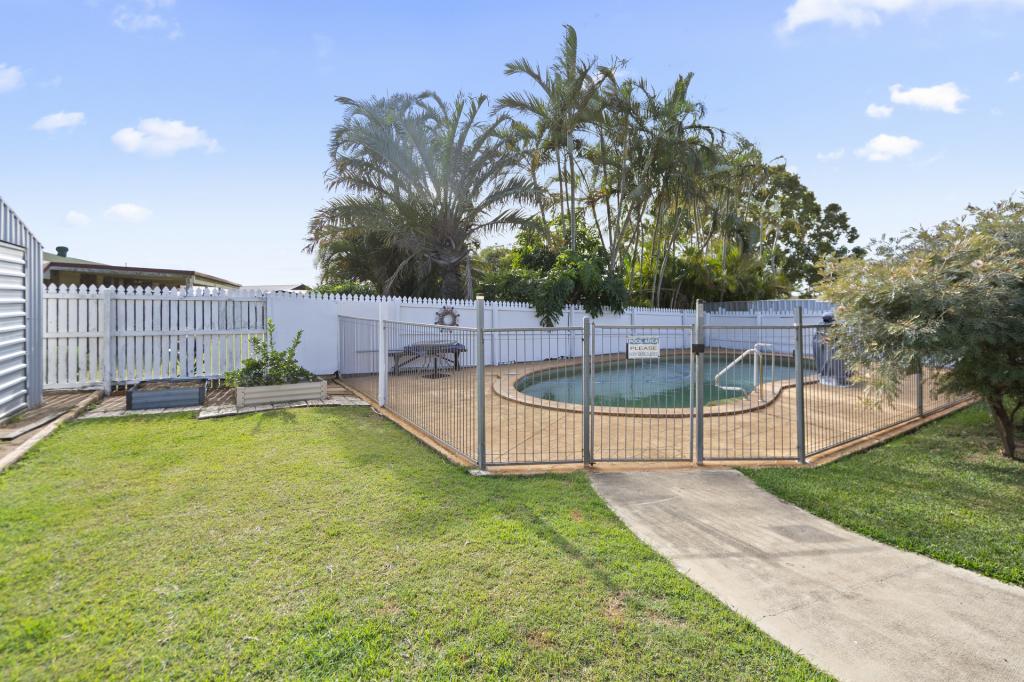
Private fenced off patio area.
Single lock up garage, with internal access to the property.
Please note the owner is wanting to offer a 12 month lease for the right applicant, the lease will start as $420 per week for the remaining of the break lease period then go to $460 per week from November onwards for the remaining of the 12 months.
Apply within, this property will go fast!!!
All images used are for illustrative purposes. These and the dimensions given are illustrative for this house/ unit type and individual properties may differ. Please check with your property manager in respect of individual properties. These dimensions should not be used for carpet or flooring sizes, appliance spaces or items of furniture. All images, photographs and dimensions are not intended to be relied upon for, nor to form part of, any contract unless specifically incorporated in writing into the lease agreement
Property Code: 744
Property History for 19/3 Ann St, Bundaberg East, QLD 4670
- 17 Jul 2024Listed for Rent - Price not available
- 25 Feb 2022Sold for $258,000
- 21 Feb 2022Listed for Sale Offers Over $255,000

Recent sales nearby
See more recent sales nearbySimilar properties For Sale nearby
See more properties for sale nearby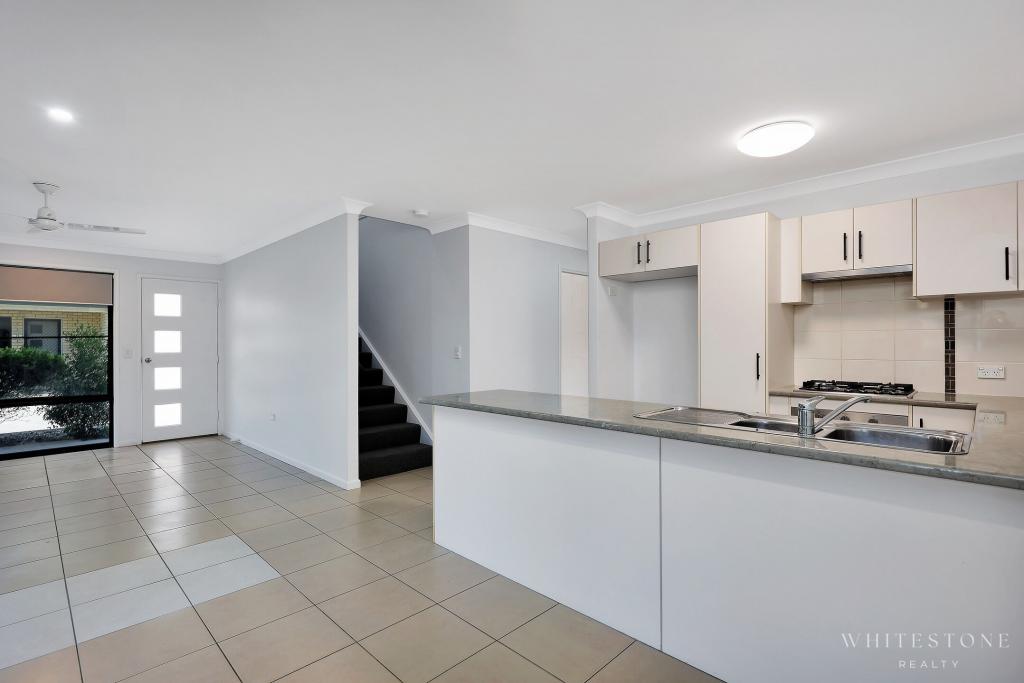 0
0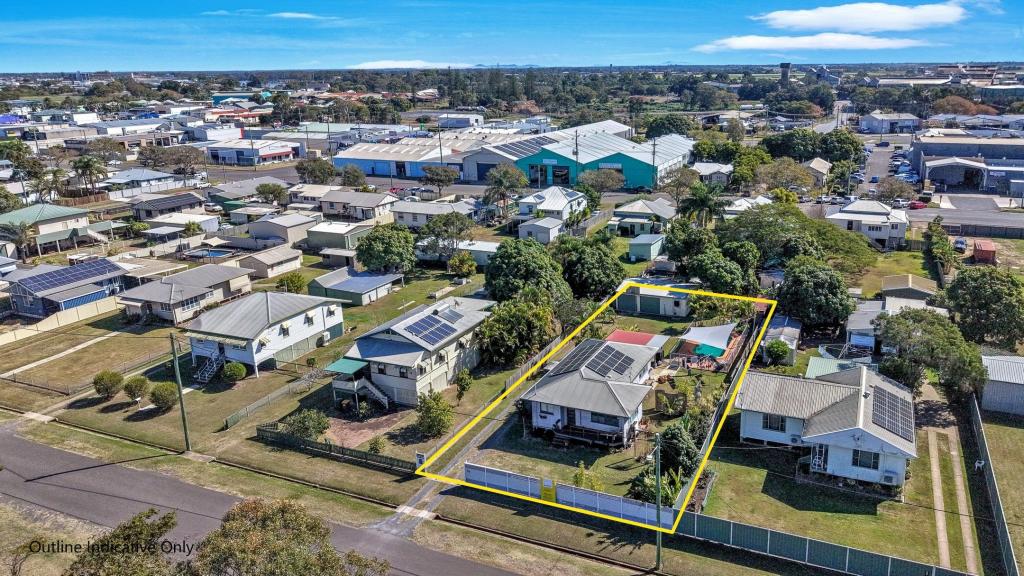 0
0 0
0Similar properties For Rent nearby
See more properties for rent nearby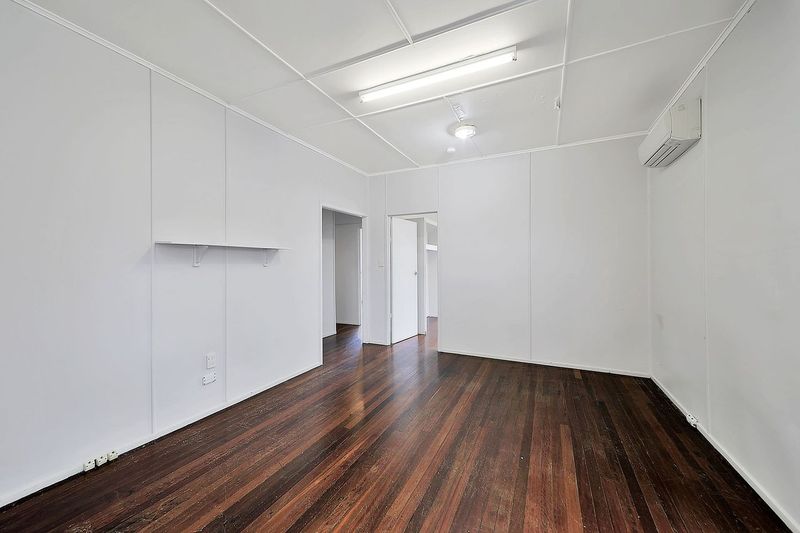 0
0 0
0
 0
0About Bundaberg East 4670
The size of Bundaberg East is approximately 4.6 square kilometres. There are 10 parks, covering nearly 15.3% of the total area. The population of Bundaberg East in 2016 was 2784 people. By 2021 the population was 2839 showing a population growth of 2.0% in the area during that time. The predominant age group in Bundaberg East is 60-69 years. Households in Bundaberg East are primarily childless couples and are likely to be repaying $1000 - $1399 per month on mortgage repayments. In general, people in Bundaberg East work in a labourer occupation.In 2021, 57.10% of the homes in Bundaberg East were owner-occupied compared with 57.50% in 2016.
Bundaberg East has 1,605 properties. Over the last 5 years, Houses in Bundaberg East have seen a 117.36% increase in median value, while Units have seen a 121.82% increase. As at 30 June 2026:
- The median value for Houses in Bundaberg East is $639,361 while the median value for Units is $601,997.
- Houses have a median rent of $580 while Units have a median rent of $460.
Suburb Insights for Bundaberg East 4670
Market Insights
Bundaberg East Trends for Houses
N/A
N/A
View TrendN/A
N/A
Bundaberg East Trends for Units
N/A
N/A
View TrendN/A
N/A
Neighbourhood Insights
© Copyright 2026. RP Data Pty Ltd trading as Cotality (Cotality). All rights reserved. No reproduction, distribution, or transmission of the copyrighted materials is permitted. The information is deemed reliable but not guaranteed.
While Cotality uses commercially reasonable efforts to ensure the Cotality Data is current, Cotality does not warrant the accuracy, currency or completeness of the Cotality Data and to the full extent permitted by law excludes all loss or damage howsoever arising (including through negligence) in connection with the Cotality Data.
This product uses cookies and other similar technologies to improve and customise your browsing experience, to tailor content and adverts, and for analytics and metrics regarding visitor usage on this product and other media. We may share cookie and analytics information with third parties for the purposes of advertising. By continuing to use our website, you consent to cookies being used. View our Privacy Policy here.
X