
9 Steven StreetBenarkin QLD 4314
Property Details for 9 Steven St, Benarkin
9 Steven St, Benarkin is a 3 bedroom, 1 bathroom House with 1 parking spaces and was built in 1960. The property has a land size of 1012m2 and floor size of 126m2. While the property is not currently for sale or for rent, it was last sold in April 2022.
Last Listing description (June 2022)
- 1 bathroom
- Town Water
- Septic
- Storage room
- Fire place
- NBN
- Built ins in all 3 bedrooms
- Front Porch
- Single carport off house
- Garden shed
- Older shed
Property History for 9 Steven St, Benarkin, QLD 4314
- 23 Apr 2022Sold for $210,000
- 19 Jan 2022Listed for Sale $225,000
- 26 Feb 2018Sold for $124,500

Recent sales nearby
See more recent sales nearby
Similar properties For Sale nearby
See more properties for sale nearby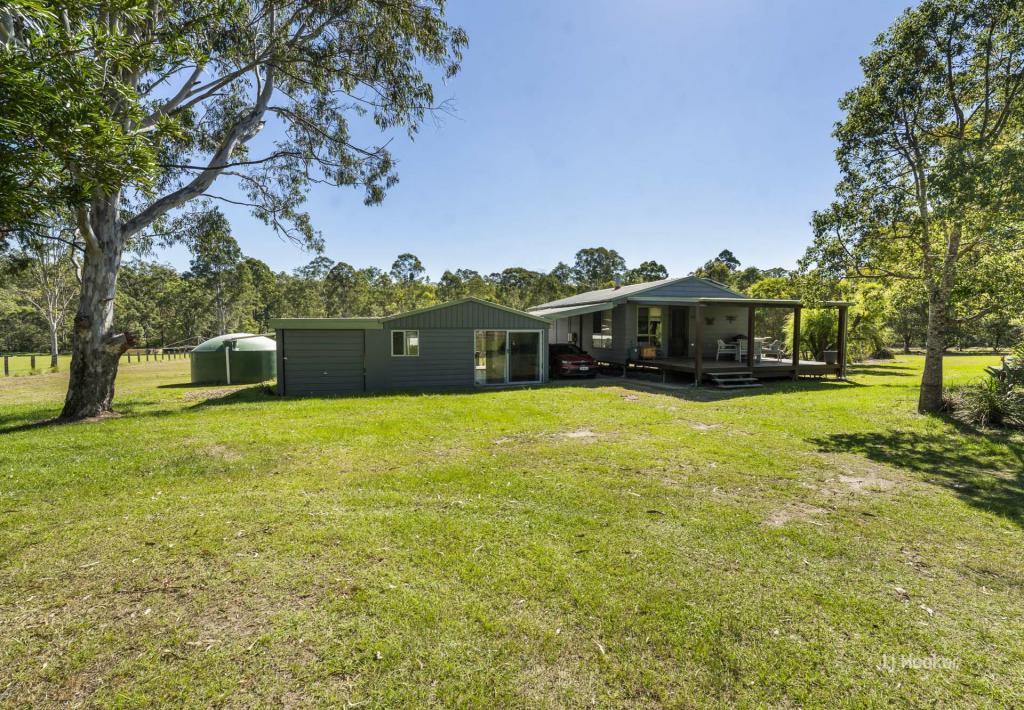 0
0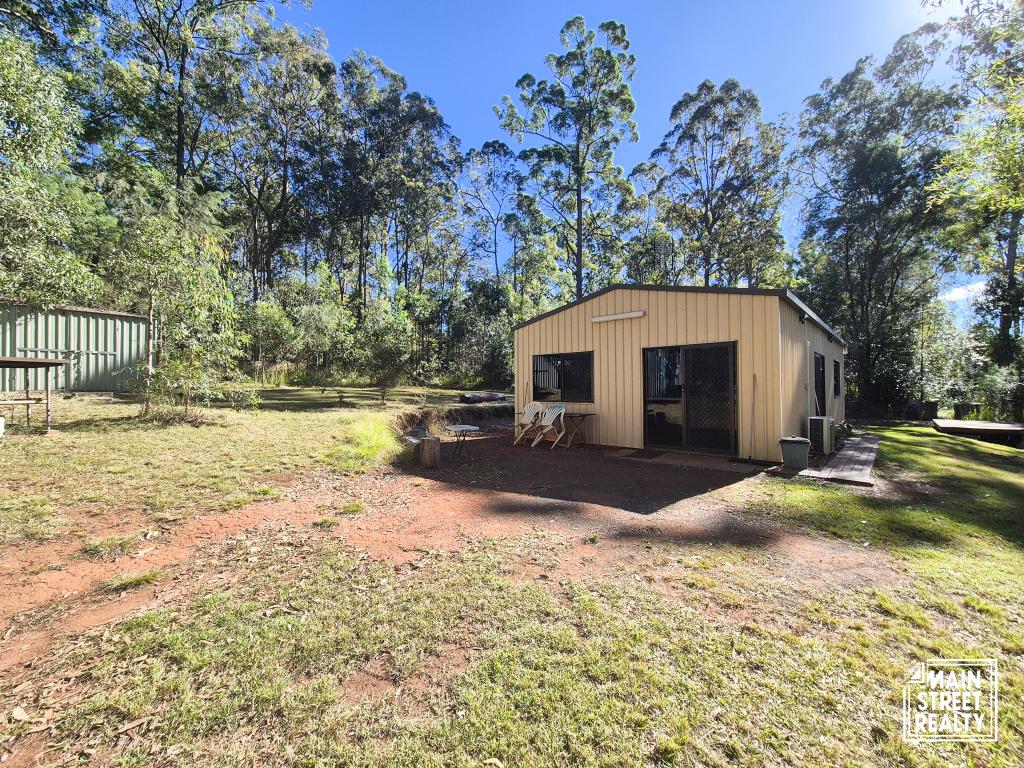 0
0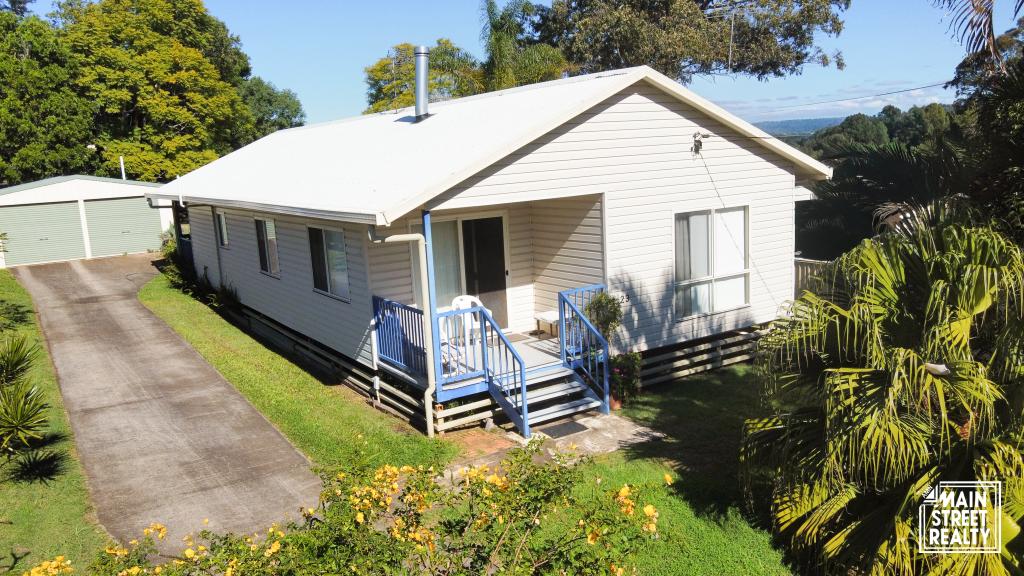 0
0About Benarkin 4314
The population of Benarkin in 2016 was 61 people. By 2021 the population was 61 showing a stable population in the area during that time. The predominant age group in Benarkin is 60-69 years. Households in Benarkin are primarily childless couples and are likely to be repaying not stated per month on mortgage repayments. In general, people in Benarkin work in a machinery operators and drivers occupation.In 2021, 60.60% of the homes in Benarkin were owner-occupied compared with 54.50% in 2016.
Benarkin has 82 properties. Over the last 5 years, Houses in Benarkin have seen a 147.32% increase in median value. As at 30 June 2026:
- The median value for Houses in Benarkin is $517,754.
Suburb Insights for Benarkin 4314
Market Insights
Benarkin Trends for Houses
N/A
N/A
View TrendN/A
N/A
Benarkin Trends for Units
N/A
N/A
View TrendN/A
N/A
Neighbourhood Insights
© Copyright 2026. RP Data Pty Ltd trading as Cotality (Cotality). All rights reserved. No reproduction, distribution, or transmission of the copyrighted materials is permitted. The information is deemed reliable but not guaranteed.
While Cotality uses commercially reasonable efforts to ensure the Cotality Data is current, Cotality does not warrant the accuracy, currency or completeness of the Cotality Data and to the full extent permitted by law excludes all loss or damage howsoever arising (including through negligence) in connection with the Cotality Data.
This product uses cookies and other similar technologies to improve and customise your browsing experience, to tailor content and adverts, and for analytics and metrics regarding visitor usage on this product and other media. We may share cookie and analytics information with third parties for the purposes of advertising. By continuing to use our website, you consent to cookies being used. View our Privacy Policy here.
X